. 2022 May 2;219(5):e20211530.
doi: 10.1084/jem.20211530. Epub 2022 Apr 22.

High-efficiency nonviral CRISPR/Cas9-mediated gene editing of human T cells using plasmid donor DNA

Affiliations

High-efficiency nonviral CRISPR/Cas9-mediated gene editing of human T cells using plasmid donor DNA

Soyoung A Oh et al. J Exp Med. .

Abstract

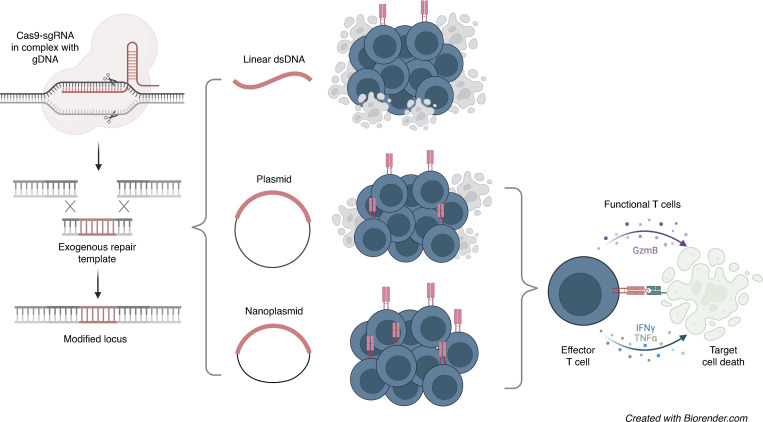
Genome engineering of T lymphocytes, the main effectors of antitumor adaptive immune responses, has the potential to uncover unique insights into their functions and enable the development of next-generation adoptive T cell therapies. Viral gene delivery into T cells, which is currently used to generate CAR T cells, has limitations in regard to targeting precision, cargo flexibility, and reagent production. Nonviral methods for effective CRISPR/Cas9-mediated gene knock-out in primary human T cells have been developed, but complementary techniques for nonviral gene knock-in can be cumbersome and inefficient. Here, we report a convenient and scalable nonviral method that allows precise gene edits and transgene integration in primary human T cells, using plasmid donor DNA template and Cas9-RNP. This method is highly efficient for single and multiplex gene manipulation, without compromising T cell function, and is thus valuable for use in basic and translational research.


Conflict of interest statement

Disclosures: S.A. Oh, K. Senger, S. Madireddi, D. Shaw, B. Haley, and S. Rutz reported a provisional patent pending. All authors are fulltime employees of Genentech, Inc. and shareholders of Roche. No other disclosures were reported.

Figures

None
Graphical abstract
Figure 1.
Figure 1.
Plasmid-based donor templates enable efficient nonviral gene editing of TRAC locus in primary T cells. (A–C) Titration of linear dsDNA donor template. (A) Diagram of linear dsDNA knock-in construct TRAC-mNG. (B) Bar graphs depicting knock-in efficiency, cell viability, total cell recovery, and edited cell recovery (mNG-positive cells) 3 d after electroporation with 1, 2, 4, 6, or 8 µg of linear dsDNA donor template together with Cas9-RNP targeting the TRAC locus. Circles represent individual donors; bars represent median values with range (n = 4). (C) Representative contour plots showing the frequency of CD8+ T cells expressing mNG. (D–F) Titration of pUC57 plasmid donor template. (D) Diagram of pUC57 knock-in construct TRAC-mNG. (E) Bar graphs showing the frequency of CD8+ T cells expressing mNG, cell viability, total cell recovery, and edited cell recovery (mNG-positive cells) 3 d after electroporation with 1, 2, 4, 6, or 8 µg of pUC57 plasmid donor template together with Cas9-RNP targeting the TRAC locus. Circles represent individual donors; bars represent median values with range (n = 4). (F) Representative contour plots showing the frequency of CD8+ T cells expressing mNG. (G–I) Titration of nanoplasmid donor template. (G) Diagram of nanoplasmid knock-in construct TRAC-mNG. (H) Bar graphs showing the frequency of CD8+ T cells expressing mNG, total cell recovery, and edited cell recovery (mNG-positive cells) 3 d after electroporation with 1, 2, 4, 6, or 8 µg of nanoplasmid donor template together with Cas9-RNP targeting the TRAC locus. Circles represent individual donors; bars represent median values with range (n = 4). (I) Representative contour plots showing the frequency of CD8+ T cells expressing mNG. This experiment was performed twice. *, P < 0.05; **, P < 0.01; ***, P < 0.001; ****, P < 0.0001 in RM one-way ANOVA with Geisser–Greenhouse correction.
Figure S1.
Figure S1.
Optimization of nonviral gene editing in primary T cells using plasmid-based donor templates. (A–F) Titration of linear dsDNA and nanoplasmid donor templates in CD8+ T cell cultures in RPMI/10% FBS medium. (A) Diagram of linear dsDNA knock-in construct TRAC-mNG. (B) Representative contour plots showing the frequency of CD8+ T cells expressing mNG. (C) Bar graphs depicting knock-in efficiency, cell viability, total cell recovery, and edited cell recovery (mNG-positive cells) of CD8+ T cells cultured in RPMI/10% FBS 3 d after electroporation with 1, 2, or 4 µg of linear dsDNA donor template together with Cas9-RNP targeting the TRAC locus. Circles represent individual donors; bars represent median values with range (n = 4). This experiment was performed twice. (D) Diagram of nanoplasmid knock-in construct TRAC-mNG. (E) Representative contour plots showing the frequency of CD8+ T cells expressing mNG. (F) Bar graphs depicting knock-in efficiency, cell viability, total cell recovery, and edited cell recovery (mNG-positive cells) of CD8+ T cells cultured in RPMI/10% FBS 3 d after electroporation with 1, 2, or 4 µg of nanoplasmid donor template together with Cas9-RNP targeting the TRAC locus. Circles represent individual donors; bars represent median values with range (n = 4). This experiment was performed twice. (G) Bar graphs depicting knock-in efficiency, cell viability, total cell recovery, and edited cell recovery 3 d after electroporation with 2 µg of either linear dsDNA or nanoplasmid donor template together with Cas9-RNP targeting the TRAC locus in the presence of absence of PGA. Circles represent individual donors; bars represent median values with range (n = 3). This experiment was performed twice. (H) Bar graphs depicting knock-in efficiency, cell viability, total cell recovery, and edited cell recovery 3 d after electroporation with 2 µg of either linear dsDNA or nanoplasmid donor template that either did or did not contain truncated Cas9 target sequences (tCTS) together with Cas9-RNP targeting the TRAC locus. Circles represent individual donors; bars represent median values with range (n = 3). This experiment has been performed twice. *, P < 0.05; **, P < 0.01; ***, P < 0.001 in RM one-way ANOVA with Geisser–Greenhouse correction (C and F) or paired t test (G and H).
Figure S2.
Figure S2.
Cytokine production and stress response induced in T cells following exposure to dsDNA donor templates. (A) IFN-α measured by Simoa and IFN-γ, TNF-α, and IL-2 measured by Luminex from CD8+ T cells 18 h after transfection with Cas9-RNP targeting the TRAC locus alone or together with nanoplasmid donor template compared with non-transfected control T cells (No RNP). Circles represent individual donors; bars represent median values with range (n = 4). This experiment was performed once for Simoa and twice for Luminex. (B) GSEA from RNA-sequencing of CD8+ T cells after transfection with Cas9-RNP targeting the TRAC with nanoplasmid donor template compared with Cas9-RNP alone. Gene sets for IFN-γ response, IFN-α response, TNF-α signaling, and inflammatory response were significantly enriched. (C) GSEA from RNA-seq of CD8+ T cells after transfection with Cas9-RNP targeting the TRAC with linear dsDNA donor template compared to Cas9-RNP alone. Gene sets for IFN-γ response, IFN-α response, TNF-α signaling, and inflammatory response were significantly enriched. (B and C) The y axis represents enrichment score, and on the x axis are genes (vertical black lines) represented in gene sets. The colored band at the bottom represents the degree of differentially expressed genes (red for upregulation and blue for downregulation). (D) Gene set enrichment analysis of all 375 upregulated genes in both Nanoplasmid/Cas9-RNP and linear dsDNA/Cas9-RNP over Cas9-RNP-only using the GSEA MSigDB Hallmark 2020. (E–H) Heatmaps showing upregulated genes in Nanoplasmid/Cas9-RNP and linear dsDNA/Cas9-RNP over Cas9-RNP-only that mostly contributed to IFN-α response (E), TNF-α response (F), apoptosis (G), or inflammatory response (H; all MSigDB Hallmark). Color-coded by the normalized RNA-seq count data with variance stabilizing transformation (VST). This experiment was performed once. *, P < 0.05; **, P < 0.01; ****, P < 0.0001 in one-way ANOVA.
Figure 2.
Figure 2.
Optimization of CRISPR/Cas9-mediated gene knock-in with plasmid-based donor DNA in CD4+ and CD8+ T cells. (A and B) Homology arm optimization for plasmid-based donor templates. (A) Representative contour plots showing the frequency of CD8+ T cells expressing mNG. (B) Bar graphs depicting knock-in efficiency, cell viability, total cell recovery, and edited cell recovery (mNG-positive cells) 3 d after electroporation with pUC57 plasmid or nanoplasmid donor templates with homology arm lengths between 100 bp and 2,000 bp (amounts equimolar to 4 µg of the pUC57 2,000 bp construct) together with Cas9-RNP targeting the TRAC locus (n = 2). Circles represent individual donors; bars represent median values with range. This experiment was performed three times. (C) Frequency of CD8+ T cells expressing mNG, cell viability, total cell recovery, and edited cell recovery (mNG-positive cells) 3 d after electroporation after stimulating cells for 24, 36, 48, or 72 h prior to electroporation with nanoplasmid donor template together with Cas9-RNP targeting the TRAC locus (n = 4). Circles represent individual donors; bars represent median values with range. This experiment was performed twice. (D) Nucleofection pulse code optimization in CD8+ T cells electroporated with nanoplasmid donor template and Cas9-RNP targeting the TRAC locus. Graph shows frequency of cells expressing mNG and edited cell recovery (mNG-positive cells) 3 d after electroporation. Each circle represents a distinct pulse code. Data are representative of three independent CD8+ T cell donors. This experiment was performed twice. (E and F) Gene editing targeting the TRAC locus in CD4+ T cells. Representative contour plot showing the frequency of CD4+ T cells expressing mNG (E) and bar graphs (F) depicting knock-in efficiency, cell viability, total cell recovery, and edited cell recovery (mNG-positive cells) 5 d after electroporation of CD4+ T cells with TRAC-mNG nanoplasmid donor template together with Cas9-RNP targeting the TRAC locus (n = 3). Circles represent individual donors; bars represent median values with range. This experiment was performed twice. *, P < 0.05; **, P < 0.01 in RM one-way ANOVA with Geisser–Greenhouse correction.
Figure 3.
Figure 3.
Nonviral TCR editing using plasmid DNA donors. (A) Diagram of TCR α and β genomic loci. V gene (purple), D gene (red), J gene (blue), and constant region (green) segments. sgTRAC and sgTRBC targeting sites are indicated. (B) Diagrams of nanoplasmid knock-in constructs TRAC-1G4TCR, TRAC-TCR6-2, and TRAC-CD19CAR. (C, E, and G) Representative contour plots (left) and bar graphs (right) showing the frequencies of CD8+ T cells expressing (C) a NY-ESO-1-specific 1G4 TCR, (E) a CMV-specific pp65 6-2 TCR, and (G) a CD19-CAR 5 d after electroporation using nanoplasmid donor templates together with Cas9-RNPs targeting the TRAC locus. (D, F, and H) Bar graphs showing the cell viability, total cell recovery, and edited cell recovery 5 d after electroporation using nanoplasmid donor templates encoding (D) a NY-ESO-1–specific 1G4 TCR, (F) a CMV-specific pp65 6-2 TCR, and (H) a CD19-CAR together with Cas9-RNPs targeting the TRAC locus. Circles represent individual donors; bars represent median values with range (n = 3). This experiment was performed three times. (I) Lactate levels in culture supernatant analyzed by luminescence using the Lactate-Glo Assay were measured 1, 3, 5, and 7 d after transfection of CD8+ T cells with sgTRAC/sgTRBC Cas9-RNP (RNP only) or sgTRAC/sgTRBC Cas9-RNP and nanoplasmid donor template targeting the TRAC locus (RNP + nanoplasmid) compared with non-transfected control T cells (No RNP); RLU, relative light units. (J) Number of cells recovered from cultures 7 d after transfection of CD8+ T cells with sgTRAC/sgTRBC Cas9-RNP (RNP only) or sgTRAC/sgTRBC Cas9-RNP and nanoplasmid donor template targeting the TRAC locus (RNP + nanoplasmid) compared with non-transfected control T cells (No RNP). This experiment was performed three times. *, P < 0.05 in RM one-way ANOVA with Geisser–Greenhouse correction.
Figure S3.
Figure S3.
Nonviral TCR editing in CD4+ and CD8+ T cells using plasmid DNA donors. (A) TCR expression on the cell surface by flow cytometry of CD8+ T cells 48 h after transfection with Cas9-RNP targeting the TRAC (sgTRAC) or TRBC (sgTRBC) loci. Circles represent individual donors; bars represent median values with range (n = 3). This experiment was performed three times. (B–G) TCR editing in CD4+ T cells. Representative contour plots showing the frequencies of CD4+ T cells expressing a NY-ESO-1-specific 1G4 TCR (B), a CMV-specific pp65 6-2 TCR (D), and a CD19-CAR (F) and bar graphs showing the knock-in efficiency and cell viability 5 d after electroporation using nanoplasmid donor templates encoding a NY-ESO-1-specific 1G4 TCR (C), a CMV-specific pp65 6-2 TCR (E), and a CD19-CAR (G) together with Cas9-RNPs targeting the TRAC locus. Circles represent individual donors; bars represent median values with range (n = 4). This experiment was performed twice. (H and I) Diagram depicting all possible translocation events between the TRAC, TRBC1, and TRBC2 genomic loci (H). Bar graph (I) showing the frequencies of individual translocation events between the TRAC, TRBC1, and TRBC2 genomic loci quantified by ddPCR in CD8+ T cells co-transfected with Cas9-RNPs targeting the TRAC and TRBC loci or in non-transfected control T cells. Circles represent individual donors; bars represent median values with range (n = 4). This experiment was performed twice. (J and K) Representative histograms (J) and bar graphs (K) showing proportions of CD137-expressing pp65 TCR knock-in CD8+ T cells stimulated with indicated concentrations of pp65495–503 peptide. Circles represent individual donors; bars represent median values with range (n = 3). This experiment was performed twice. (L) Bar graphs showing IFN-γ and TNF-α production by pp65 TCR knock-in CD8+ T cells stimulated with indicated concentrations of pp65495–503 peptide. Circles represent individual donors; bars represent median values with range (n = 3). This experiment was performed twice. (M) Representative histograms showing the frequencies of CFSE-positive target cells and CFSE-negative reference cells in co-cultures with pp65 TCR knock-in CD8+ T cells in the absence or presence of the cognate peptide. (N) Graphs showing specific lysis calculated in the absence of peptide or with 0.1 µM of pp65495–503 peptide. Circles represent individual donors; bars represent median values with range (n = 3). This experiment was performed twice. (O) Bar graphs showing IFN-γ and TNF-α production by TCR6-2 (irrelevant TCR) or CD19-CAR knock-in CD4+ T cells from two donors (D1 and D2) in co-cultures with CD19-expressing B cells. Circles represent technical replicates; bars represent median values with range (n = 9). This experiment was performed twice. *, P < 0.05; **, P < 0.01; ***, P < 0.001; ****, P < 0.0001 in RM one-way ANOVA with Geisser–Greenhouse correction (A and K), paired t test (N), and one-way ANOVA (O).
Figure 4.
Figure 4.
TCR-engineered T cells recognize and kill antigen-expressing target cells. (A and B) Representative histograms (A) and bar graphs (B) showing proportion of CD137 expression of 1G4 TCR knock-in CD8+ T cells stimulated with indicated concentrations of NY-ESO-1157–165 peptide. Circles represent individual donors; bars represent median values with range (n = 4). This experiment was performed twice. (C and D) Bar graphs showing IFN-γ (C) or TNF-α (D) production by 1G4 TCR knock-in CD8+ T cells stimulated with indicated concentrations of NY-ESO-1157–165 peptide. Circles represent individual donors; bars represent median values with range (n = 4). This experiment was performed twice. (E) Representative histograms showing the frequencies of CFSE-positive target cells and CFSE-negative reference cells in co-cultures with 1G4 TCR knock-in CD8+ T cells in the absence or presence of the cognate peptide. (F) Graphs showing specific lysis calculated in the absence of peptide or with 0.1 µM of NY-ESO-1157–165 peptide. Circles represent individual donors; bars represent median values with range (n = 4). This experiment was performed twice. (G) Bar graphs showing IFN-γ, TNF-α, and granzyme B (GzmB) production by TCR knock-out or 1G4 TCR knock-in CD8+ T cells from three donors co-cultured with A-375 cells that express the NY-ESO-1 antigen. Circles represent technical replicates; bars represent median values with range (n = 3). This experiment was performed twice. (H) Representative images for A-375 cells that express the NY-ESO-1 antigen and were labeled with a cytoplasmic dye and co-cultured with TCR knock-out CD8+ T cells (left) or 1G4 TCR knock-in CD8+ T cells (right) 2 and 18 h after culture seeding in the presence of caspase 3/7-green apoptosis reagent. Scale bars indicate 300 µm distance. (I) Representative target cell killing over time as measured by the Cas3/7-positive object count in co-cultures of A-375 cells expressing the NY-ESO-1 antigen and labeled with a cytoplasmic dye and co-cultured with TCR knock-out CD8+ T cells (open circles) or 1G4 TCR knock-in CD8+ T cells (filled circles). Mean values ± SD of six technical replicates. This experiment was performed twice with three independent donors per experiment. *, P < 0.05; **, P < 0.01; ***, P < 0.001; ****, P < 0.0001 in RM one-way ANOVA with Geisser–Greenhouse correction (B–D); paired t test (F); one-way ANOVA (G); or Tukey’s multiple comparisons test, two-way ANOVA (I).
Figure S4.
Figure S4.
Kinetics of gene expression following transient transfection of linear dsDNA, plasmid, and nanoplasmid. (A) Diagram of nanoplasmid knock-in construct RAB11A-YFP. (B and C) Representative histograms showing the frequencies of CD8+ T cells expressing YFP (B) and bar graphs (C) depicting frequency of YFP expression, cell viability, total cell recovery, and edited cell recovery 3, 5, or 7 d after electroporation with promoter-containing nanoplasmid donor template together with (red) or without (blue) Cas9-RNPs targeting the RAB11A locus. Circles represent technical replicates; bars represent median values with range (n = 3). This experiment was performed twice. (D) Diagram of linear dsDNA knock-in construct RAB11A-YFP. (E and F) Representative histograms showing the frequencies of CD8+ T cells expressing YFP (E) and bar graph (F) depicting frequency of YFP expression 3, 5, or 7 d after electroporation with promoter-containing linear dsDNA donor templates together with (red) or without (blue) Cas9-RNPs targeting the RAB11A locus. Circles represent technical replicates; bars represent median values with range (n = 3). This experiment was performed once. (G) Diagram of pUC57 plasmid knock-in construct RAB11A-YFP. (H and I) Representative histograms showing the frequencies of CD8+ T cells expressing YFP (H) and bar graph (I) depicting frequency of YFP expression 3, 5, or 7 d after electroporation with promoter-containing pUC57 plasmid donor templates together with (red) or without (blue) Cas9-RNPs targeting the RAB11A locus. Circles represent technical replicates; bars represent median values with range (n = 3). This experiment was performed twice. *, P < 0.05; **, P < 0.05; ***, P < 0.001 in Sidak’s multiple comparisons test with RM one-way ANOVA with Geisser–Greenhouse correction.
Figure 5.
Figure 5.
Generation of reporters of gene expression. (A) Diagram of nanoplasmid knock-in construct RAB11A-YFP. (B and C) Histogram overlay for YFP expression (B) and bar graphs (C) showing the frequency of YFP expression and cell viability of CD8+ T cells transfected with RAB11A-YFP nanoplasmid with or without RAB11A targeting Cas9-RNP 10 d after electroporation. Circles represent individual donors; bars represent median values with range (n = 3). This experiment was performed three times. (D) Diagram of nanoplasmid knock-in construct AAVS1-mNG. (E and F) Histogram overlay for mNG expression (E) and bar graphs (F) showing the frequency of mNG expression and cell viability of CD8+ T cells transfected with AAVS1-mNG nanoplasmid with or without AAVS1 targeting Cas9-RNP 10 d after electroporation. Circles represent individual donors, and bars represent median values with range (n = 4). This experiment was performed three times. (G) Diagram of nanoplasmid knock-in construct CD4-mNG. (H and I) Representative contour plots (H) and bar graphs (I) showing the frequency of CD4+ and CD8+ T cells expressing mNG and cell viability 10 d after electroporation of a nanoplasmid donor template and Cas9-RNP targeting the CD4 locus. Circles represent individual donors, and bars represent median values with range (n = 4 for CD4+ T cells, n = 3 for CD8+ T cells). This experiment was performed twice. (J) Histogram overlay for CD4 expression in CD4+ T cells transfected with CD4-mNG nanoplasmid together with a non-targeting control Cas9-RNP (sgNTC) or a Cas9-RNP targeting the CD4 locus (sgCD4) 10 d after electroporation. (K) Diagrams of nanoplasmid knock-in constructs TNFRSF9-mNG and RAB11A-YFP (left) and representative contour plots (right) showing the frequency of CD8+ T cells expressing CD137 and mNG after electroporation with a nanoplasmid mNG reporter construct targeting the TNFRSF9 locus or a constitutive YFP expressing construct targeting the RAB11A locus together with the respective Cas9-RNP either without restimulation or 6 h after restimulation with Transact. (L) Bar graphs showing the frequency of YFP (blue) and mNG (red) expressing CD8+ T cells over time after electroporation with a nanoplasmid mNG reporter construct targeting the TNFRSF9 locus or a constitutive YFP expressing construct targeting the RAB11A locus together with the respective Cas9-RNP and restimulation with Transact at time 0 h. Circles represent individual donors; bars represent median values with range (n = 4). This experiment was performed twice. (M) Bar graphs showing the geometric mean fluorescent intensity (gMFI) of CD137 expression in CD8+ T cells over time after electroporation with a nanoplasmid mNG reporter construct targeting the TNFRSF9 locus or a constitutive YFP expressing construct targeting the RAB11A locus together with the respective Cas9-RNP and restimulation with Transact at time 0 h (n = 4). Circles represent individual donors; bars represent median values with range. *, P < 0.05; **, P < 0.01 in paired t test (C, F, I, and J) or in RM one-way ANOVA with Geisser–Greenhouse correction (L).
Figure 6.
Figure 6.
Multiplexed gene knock-in in human T cells. (A–C) Diagrams of nanoplasmid knock-in constructs are provided on the top. Representative contour plots (left) and bar graphs (right) showing the frequency of CD8+ T cells expressing mNG (A) 10 d after electroporation with a nanoplasmid TRAC-mNG donor template and Cas9-RNPs targeting the TRAC locus, mCherry (B) 10 d after electroporation with a nanoplasmid TRAC-mCherry donor template and Cas9-RNPs targeting the TRAC locus, or either mNG or mCherry (C) 10 d after electroporation with two nanoplasmid donor templates (TRAC-mNG and TRAC-mCherry) and Cas9-RNPs targeting the TRAC locus. Graph on the right for C indicates proportion of transgene expressing cells that express mNG (green), mCherry (red), or both (blue). Circles represent individual donors; bars represent median values with range (n = 3). This experiment was performed three times. (D–F) Diagrams of nanoplasmids used in dual targeting study, RAB11A-YFP and TRAC-mCherry (D); representative contour plot (E) showing the frequency of CD8+ T cells expressing YFP, mCherry, or both; and bar graphs (F) showing knock-in efficiency, cell viability, and total cell recovery of CD8+ T cells 10 d after electroporation with nanoplasmid donors RAB11A-YFP and TRAC-mCherry and Cas9-RNPs targeting the RAB11A and TRAC loci. (G) Proportion of transgene expressing T cells co-transfected with nanoplasmid donors RAB11A-YFP and TRAC-mCherry and Cas9-RNPs targeting the RAB11A and TRAC loci that express YFP (green), mCherry (red), or both (blue). Circles represent individual donors, and bars represent median values with range (n = 4). This experiment was performed three times. (H) Diagrams of nanoplasmids used in dual targeting study, AAVS1-mNG and TRAC-mCherry. (I and J) Representative contour plot showing the frequency of CD8+ T cells expressing mNG, mCherry or both (I) and bar graphs (J) showing knock-in efficiency, cell viability, and total cell recovery of CD8+ T cells 10 d after electroporation with nanoplasmid donors AAVS1-mNG and TRAC-mCherry and Cas9-RNPs targeting the AAVS1 and TRAC loci. (K) Proportion of transgene expressing cells co-transfected with nanoplasmid donors AAVS1-mNG and TRAC-mCherry and Cas9-RNPs targeting the AAVS1 and TRAC loci that express mNG (green), mCherry (red), or both (blue). Circles represent individual donors; bars represent median values with range (n = 4). This experiment was performed twice. *, P < 0.05; **, P < 0.01 in RM one-way ANOVA with Geisser–Greenhouse correction.
Figure S5.
Figure S5.
Multiplexed gene knock-in in human T cells. (A–C) Diagrams of pUC57 plasmid knock-in constructs are provided on the top. Representative contour plots (left) and bar graphs (right) showing the frequency of CD8+ T cells expressing mNG (A) 10 d after electroporation with a pUC57 plasmid TRAC-mNG donor template and Cas9-RNPs targeting the TRAC locus (n = 3), mCherry (B) 10 d after electroporation with a pUC57 plasmid TRAC-mCherry donor template and Cas9-RNPs targeting the TRAC locus (n = 3), or either mNG or mCherry (C) 10 d after electroporation with two pUC57 plasmid donor templates (TRAC-mNG and TRAC-mCherry) and Cas9-RNPs targeting the TRAC locus (n = 3). Graph on the right for C indicates proportion of transgene expressing cells that express mNG (green), mCherry (red), or both (blue). Circles represent individual donors; bars represent median values with range. This experiment was performed three times. (D) Diagrams of pUC57 plasmids used in dual targeting study, RAB11A-YFP and TRAC-mCherry. (E and F) Representative contour plot showing the frequency of CD8+ T cells expressing YFP, mCherry or both (E) and bar graphs (F) showing knock-in efficiency, cell viability, and total cell recovery of CD8+ T cells 10 d after electroporation with pUC57 donors RAB11A-YFP and TRAC-mCherry and Cas9-RNPs targeting the RAB11A and TRAC loci. (G) Proportion of transgene expressing cells co-transfected with pUC57 donor templates RAB11A-YFP and TRAC-mCherry and Cas9-RNPs targeting the RAB11A and TRAC loci that express YFP (green), mCherry (red), or both (blue). Circles represent individual donors; bars represent median values with range (n = 4). This experiment was performed three times. *, P < 0.05; **, P < 0.01 in RM one-way ANOVA with Geisser–Greenhouse correction.
Figure 7.
Figure 7.
Nonviral CRISPR gene editing with large payloads. (A) Diagram of nanoplasmid knock-in constructs TRAC_NotchICD_mNG, TRAC_NotchICD_1G4, and TRAC_THEMIS_1G4. (B, D, and F) Representative contour plots showing the frequency of CD8+ T cells expressing mNG (B) or 1G4 TCR (D and F) 5 d after electroporation of a NotchICD_mNG (B), NotchICD_1G4 (D), or THEMIS_1G4 (F) nanoplasmid donor template together with Cas9-RNP targeting the TRAC locus. (C, E, and G) Bar graphs showing the frequency of CD8+ T cells expressing mNG (C) or 1G4 TCR (E and G) and cell viability 5 d after electroporation of a NotchICD_mNG (C), NotchICD_1G4 (E), or THEMIS_1G4 (G) nanoplasmid donor template together with Cas9-RNP targeting the TRAC locus. Circles represent individual donors, and bars represent median values with range (n = 3). This experiment was performed three times. *, P < 0.05; **, P < 0.01 in paired t test.

References

    1. Anders, S., and Huber W.. 2010. Differential expression analysis for sequence count data. Genome Biol. 11:R106. 10.1186/gb-2010-11-10-r106 - DOI - PMC - PubMed
    1. Bak, R.O., Dever D.P., and Porteus M.H.. 2018. CRISPR/Cas9 genome editing in human hematopoietic stem cells. Nat. Protoc. 13:358–376. 10.1038/nprot.2017.143 - DOI - PMC - PubMed
    1. Bloemberg, D., Nguyen T., MacLean S., Zafer A., Gadoury C., Gurnani K., Chattopadhyay A., Ash J., Lippens J., Harcus D., et al. . 2020. A high-throughput method for characterizing novel chimeric antigen receptors in jurkat cells. Mol. Ther. Methods Clin. Dev. 16:238–254. 10.1016/j.omtm.2020.01.012 - DOI - PMC - PubMed
    1. Choi, B.D., Yu X., Castano A.P., Darr H., Henderson D.B., Bouffard A.A., Larson R.C., Scarfò I., Bailey S.R., Gerhard G.M., et al. . 2019. CRISPR-Cas9 disruption of PD-1 enhances activity of universal EGFRvIII CAR T cells in a preclinical model of human glioblastoma. J. Immunother. Cancer. 7:304. 10.1186/s40425-019-0806-7 - DOI - PMC - PubMed
    1. Chu, V., Weber T., Wefers B., Wurst W., Sander S., Rajewsky K., and Kühn R.. 2015. Increasing the efficiency of homology-directed repair for CRISPR-Cas9-induced precise gene editing in mammalian cells. Nat. Biotechnol. 33:543–548. 10.1038/nbt.3198 - DOI - PubMed