. 2022 Apr 1;5(4):e228526.
doi: 10.1001/jamanetworkopen.2022.8526.

COVID-19 Vaccination and Estimated Public Health Impact in California

Affiliations

COVID-19 Vaccination and Estimated Public Health Impact in California

Sophia T Tan et al. JAMA Netw Open. .

Abstract

Importance: Despite widespread vaccination against COVID-19 in the United States, there are limited empirical data quantifying their public health impact in the population.

Objective: To estimate the number of COVID-19 cases, hospitalizations, and deaths directly averted because of COVID-19 vaccination in California.

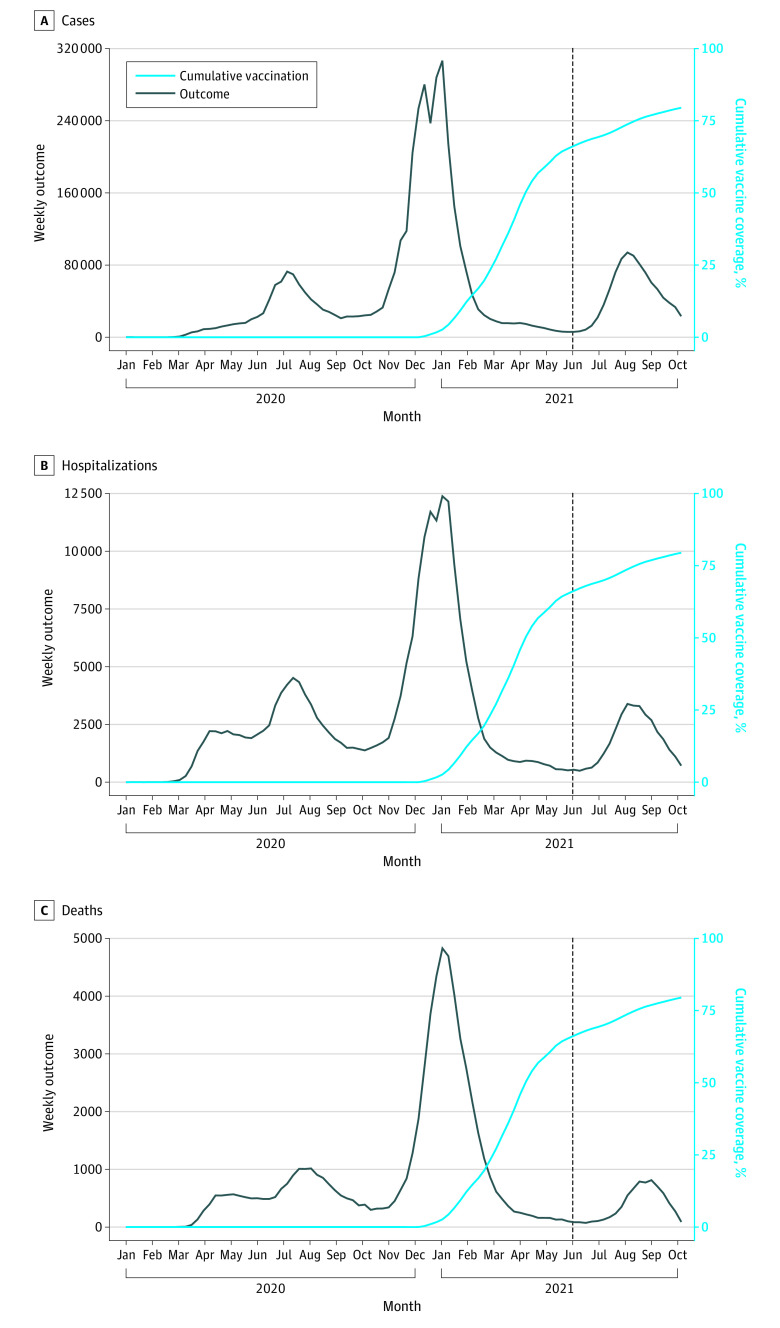
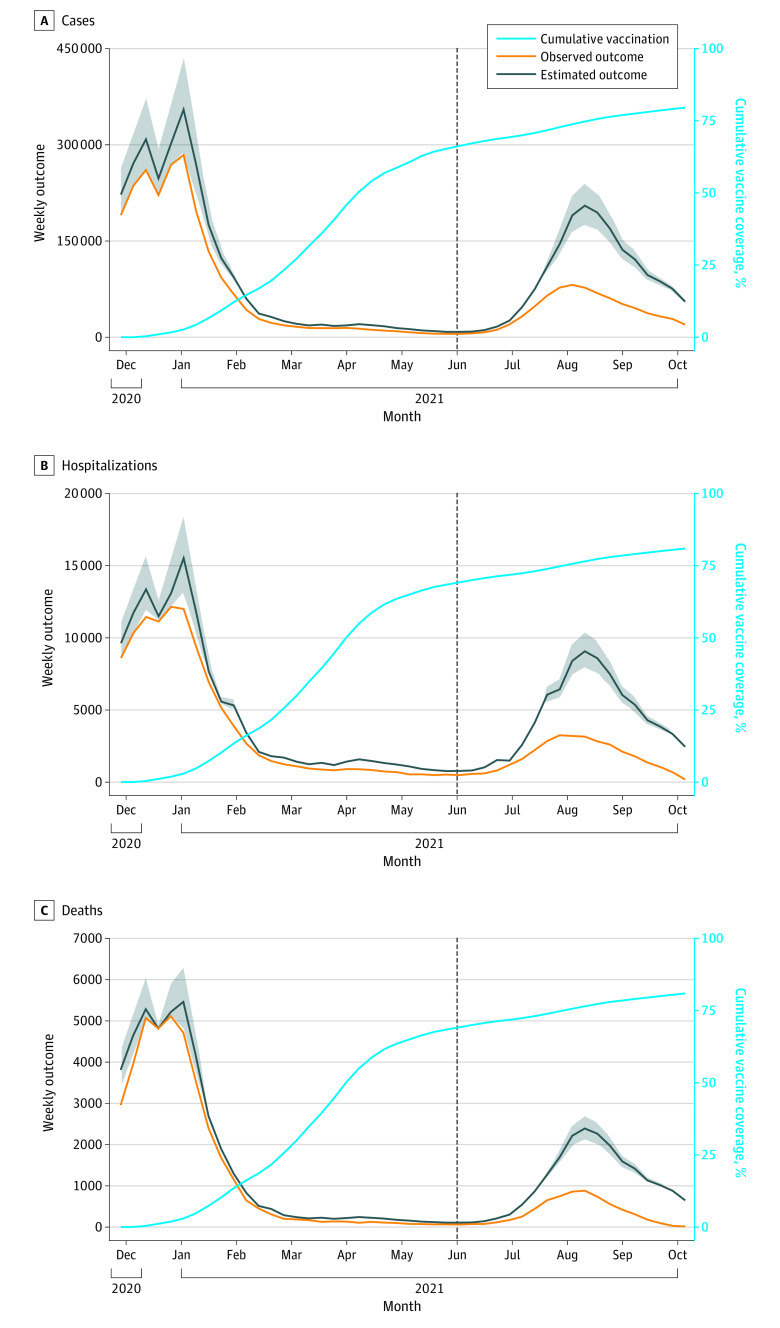
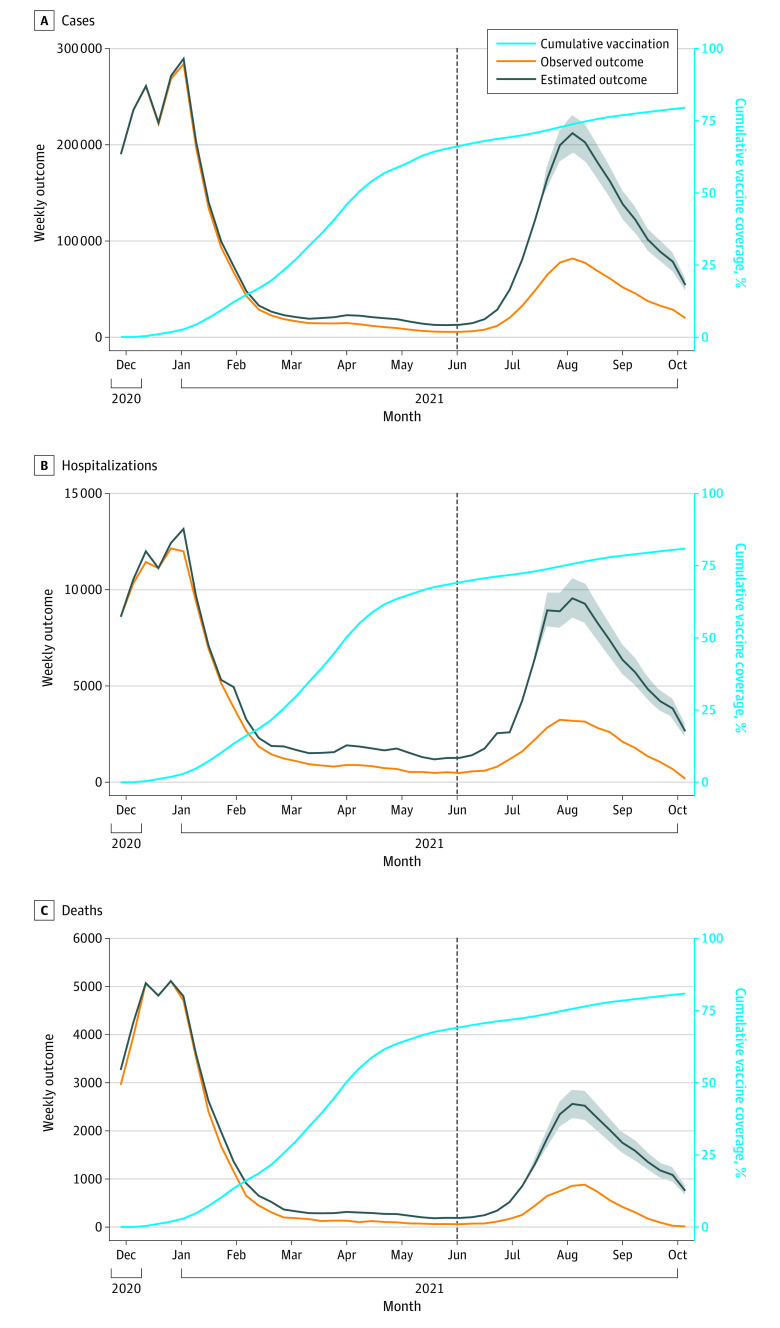
Design, setting, and participants: This modeling study used person-level data provided by the California Department of Public Health (CDPH) on COVID-19 cases, hospitalizations, and deaths as well as COVID-19 vaccine administration from January 1, 2020, to October 16, 2021. A statistical model was used to estimate the number of COVID-19 cases that would have occurred in the vaccine era (November 29, 2020, to October 16, 2021) in the absence of vaccination based on the ratio of the number of cases among the unvaccinated (aged <12 years) and vaccine-eligible groups (aged ≥12 years) before vaccine introduction. Vaccine-averted COVID-19 cases were estimated by finding the difference between the projected and observed number of COVID-19 cases. Averted COVID-19 hospitalizations and deaths were assessed by applying estimated hospitalization and case fatality risks to estimates of vaccine-averted COVID-19 cases. As a sensitivity analysis, a second independent model was developed to estimate the number of vaccine-averted COVID-19 outcomes by applying published data on vaccine effectiveness to data on COVID-19 vaccine administration and estimated risk of COVID-19 over time.

Exposure: COVID-19 vaccination.

Main outcomes and measures: Number of COVID-19 cases, hospitalizations, and deaths estimated to have been averted because of COVID-19 vaccination.

Results: There were 4 585 248 confirmed COVID-19 cases, 240 718 hospitalizations, and 70 406 deaths in California from January 1, 2020, to October 16, 2021, during which 27 164 680 vaccine-eligible individuals aged 12 years and older were reported to have received at least 1 dose of a COVID-19 vaccine in the vaccine era (79.5% of the eligible population). The primary model estimated that COVID-19 vaccination averted 1 523 500 (95% prediction interval [PI], 976 800-2 230 800) COVID-19 cases in California, corresponding to a 72% (95% PI, 53%-91%) relative reduction in cases because of vaccination. COVID-19 vaccination was estimated to have averted 72 930 (95% PI, 53 250-99 160) hospitalizations and 19 430 (95% PI, 14 840-26 230) deaths during the study period. The alternative model identified comparable findings.

Conclusions and relevance: This study provides evidence of the public health benefit of COVID-19 vaccination in the United States and further supports the urgency for continued vaccination.


Conflict of interest statement

Conflict of Interest Disclosures: Dr Lo reported receiving personal fees from the World Health Organization outside the submitted work. No other disclosures were reported.

Figures

Figure 1.
Figure 1.. COVID-19 Cases, Hospitalizations, Deaths, and Vaccination Over Time in California
Data on COVID-19 cases were obtained from the California Department of Public Health for the period of January 1, 2020, to October 16, 2021. Weekly absolute cases (A), hospitalizations (B), and deaths (C) were plotted (black line). Cumulative coverage of COVID-19 vaccination in the population aged 12 years or older was plotted (light blue line) using publicly available data from November 29, 2020, to October 16, 2021. Date of vaccination was defined as the date of first vaccine dose receipt in persons who received at least 1 dose of a COVID-19 vaccine (BNT162b2, mRNA-1273, or Ad26.COV2.S). The dashed line (black) represents the introduction of the Delta variant in California.
Figure 2.
Figure 2.. Primary Model Estimation of Averted COVID-19 Cases, Hospitalizations, and Deaths Because of COVID-19 Vaccination
Observed COVID-19 cases in the population aged 12 years and older (A) and hospitalizations (B) and deaths (C) in the population aged 18 years and older was plotted (orange line) over time. Cumulative vaccine coverage of at least 1 dose of a COVID-19 vaccine was plotted over time in the vaccine-eligible population (light blue line). The ratio between cases in the unvaccinated group (aged <12 years) and each vaccine-eligible age group before phase 1a of vaccination was used to project COVID-19 cases in each vaccine-eligible age group in absence of vaccination (black line, with shaded areas indicating prediction intervals). We used weekly hospitalization and death risks to project hospitalizations and deaths in the absence of vaccination. The dashed line represents introduction of the Delta variant in California. The difference between estimated COVID-19 outcomes without vaccination (black line) and observed COVID-19 outcomes with vaccine (orange line) represents the averted COVID-19 outcomes because of vaccination.
Figure 3.
Figure 3.. Alternative Model Estimation of Averted COVID-19 Cases, Hospitalizations, and Deaths Because of COVID-19 Vaccination
Observed COVID-19 cases in the population aged 12 years and older (A) and hospitalizations (B) and deaths (C) in the population aged 18 years and older were plotted (orange line). Cumulative vaccine coverage of at least 1 dose of a COVID-19 vaccine was plotted (light blue line). This analysis used an alternative modeling approach for estimating vaccine-averted COVID-19 cases. COVID-19 case incidence was estimated over time, accounting for natural and vaccine-induced immunity. This COVID-19 incidence was used to project weekly cases in the vaccine-eligible group, under the scenario of no vaccination (black line, with shaded areas indicating uncertainty intervals). Monthly COVID-19 hospitalization and death risks were applied to estimate COVID-19 hospitalizations and deaths. The difference between estimated COVID-19 outcomes without vaccination (black line) and observed COVID-19 outcomes with vaccine (orange line) represents the estimated averted COVID-19 outcomes because of vaccination. The dashed line represents introduction of the Delta variant in California.

References

    1. Matrajt L, Leung T. Evaluating the effectiveness of social distancing interventions to delay or flatten the epidemic curve of coronavirus disease. Emerg Infect Dis. 2020;26(8):1740-1748. doi:10.3201/eid2608.201093 - DOI - PMC - PubMed
    1. Brooks JT, Butler JC. Effectiveness of mask wearing to control community spread of SARS-CoV-2. JAMA. 2021;325(10):998-999. doi:10.1001/jama.2021.1505 - DOI - PMC - PubMed
    1. Dooling K, Marin M, Wallace M, et al. . The Advisory Committee on Immunization Practices’ updated interim recommendation for allocation of COVID-19 vaccine—United States, December 2020. MMWR Morb Mortal Wkly Rep. 2021;69(5152):1657-1660. doi:10.15585/mmwr.mm695152e2 - DOI - PMC - PubMed
    1. Oliver SE, Gargano JW, Marin M, et al. . The Advisory Committee on Immunization Practices’ interim recommendation for use of Pfizer-BioNTech COVID-19 vaccine—United States, December 2020. MMWR Morb Mortal Wkly Rep. 2020;69(50):1922-1924. doi:10.15585/mmwr.mm6950e2 - DOI - PMC - PubMed
    1. Baden LR, El Sahly HM, Essink B, et al. ; COVE Study Group . Efficacy and safety of the mRNA-1273 SARS-CoV-2 vaccine. N Engl J Med. 2021;384(5):403-416. doi:10.1056/NEJMoa2035389 - DOI - PMC - PubMed

Publication types

Substances