Review
. 2022 Aug;88(2):546-574.
doi: 10.1002/mrm.29241. Epub 2022 Apr 22.

Review and consensus recommendations on clinical APT-weighted imaging approaches at 3T: Application to brain tumors

Affiliations
Review

Review and consensus recommendations on clinical APT-weighted imaging approaches at 3T: Application to brain tumors

Jinyuan Zhou et al. Magn Reson Med. 2022 Aug.

Abstract

Amide proton transfer-weighted (APTw) MR imaging shows promise as a biomarker of brain tumor status. Currently used APTw MRI pulse sequences and protocols vary substantially among different institutes, and there are no agreed-on standards in the imaging community. Therefore, the results acquired from different research centers are difficult to compare, which hampers uniform clinical application and interpretation. This paper reviews current clinical APTw imaging approaches and provides a rationale for optimized APTw brain tumor imaging at 3 T, including specific recommendations for pulse sequences, acquisition protocols, and data processing methods. We expect that these consensus recommendations will become the first broadly accepted guidelines for APTw imaging of brain tumors on 3 T MRI systems from different vendors. This will allow more medical centers to use the same or comparable APTw MRI techniques for the detection, characterization, and monitoring of brain tumors, enabling multi-center trials in larger patient cohorts and, ultimately, routine clinical use.

Keywords: APT-weighted imaging; APTw standardization; CEST imaging; brain tumor.


Conflict of interest statement

J.Z. and P.C.M.v.Z. are paid lecturers for Philips and are the inventors of technology (including APTw MRI) licensed to Philips. P.C.M.v.Z. also has research support from Philips Healthcare. These arrangements have been approved by Johns Hopkins University in accordance with its conflict‐of‐interest policies.

Figures
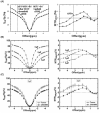
FIGURE 1
FIGURE 1
(A) Z‐spectra and MTRasym spectra measured from a 9 L rat brain tumor model at 4.7 T (12 days post‐implantation, n = 6, T sat = 4 s, B1 = 1.3 μT). Tumor: open circles; contralateral normal brain tissue: solid circles. The APT effect is visible as a small resonance at the offset of 3.5 ppm in the Z‐spectrum. The effect is stronger in the tumor than in the contralateral normal region. There is a small difference between the downfield and upfield semi‐solid MTC effects (namely, MTC vs. MTC′) in normal tissue, which is reduced in the tumor. Reproduced with permission and with some additions from Salhotra et al. (B) Z‐spectra and MTRasym spectra of white matter from healthy subjects (n = 4), obtained at 3 T with 3 different RF saturation strengths and T sat = 500 ms. The error bars are too small to see clearly. White matter MTRasym(3.5 ppm) is roughly 0 at 2 μT. (C) Z‐spectra and MTRasym spectra measured from brain tumor patients at 3 T (n = 8, T sat = 500 ms, B1 = 2 μT). Tumor: open squares; contralateral normal‐appearing white matter (CNAWM): solid circles. The APTw signal is stronger in the tumor than in the CNAWM. (B) and (C) reproduced with permission from Zhao et al.
FIGURE 2
FIGURE 2
Illustration of the need for a saturation period (T sat) on the order of 1‐2 s and for a high RF saturation duty cycle (DCsat) for APTw MRI of brain tumors at 3 T. Gd‐enhanced T1w images are included with each example as a morphological reference. (A) An example of APTw MRI (B1rms = 2 μT, DCsat = 100%) for a patient with glioblastoma showing that the APTw signal in the relevant regions increases with T sat. Reproduced from Togao et al. (B) APTw and Gd‐enhanced T1w images for a glioblastoma patient acquired with 3 different pulse‐train RF saturation modules (B1rms = 2 μT). The APTw hyperintensity can be seen clearly in the tumor region relative to normal‐appearing brain tissue, the highest for the module (T sat = 2 s, DCsat = 91%) and the lowest for the module (T sat = 2 s, DCsat = 50%). Reproduced from Herz et al.
FIGURE 3
FIGURE 3
Schematic representation of parallel RF transmission (pTX, dual transmit here) (A), alternated over time (B), used for APTw MRI RF saturation. To achieve 100% duty‐cycle RF saturation, 2 independent sources, RF1 and RF2, are driven by the RF amplifiers in a time‐interleaved fashion, therefore, running each amplifier at 50% duty‐cycle and limited pulse duration according to the hardware specifications. Reproduced with permission from Keupp et al.,
FIGURE 4
FIGURE 4
APTw images at 3 T acquired at different RF saturation strengths. (A) A patient with cerebral metastasis. The tumor (red arrows) shows hyperintense signal on all APTw images. However, the lesion margins are poorly delineated on the APTw image at 1 μT because of the presence of cerebrospinal fluid (CSF) artifacts (white arrows). Reproduced with permission from Zhao et al. (B) A glioma patient post‐treatment. The APTw signals at different B1 strengths are all around 0 in the resection cavity (as in CSF), but very different in normal brain tissue (Figure 1B). Therefore, at 1 μT, the resection cavity (red arrow) shows unexpected apparent APTw hyperintensity. However, the APTw image at 2 μT is homogenous for most brain regions, including the resection cavity (red arrow). Notice the residual hyperintensity in the sagittal sinus likely because of the high protein content of blood. Unpublished data from Dr. Hye‐Young Heo. The study was approved by the local Institutional Review Board
FIGURE 5
FIGURE 5
Recommended RF saturation methods for APTw imaging of brain tumors on 3 T clinical MRI scanners. (A) CW RF saturation (T sat = 2 s, B1 = 2 μT). (B1‐B3) Three pulse‐train RF saturation examples (T sat = 2 s, B1rms = 2 μT) with high DCsat (≥90%), respectively, proposed to be used initially on the Philips system by Keupp et al, on the Siemens system by Zhang et al, and on the GE system by Su et al. Note that (B1) is typically achieved with the time‐interleaved pTX technique. Single‐lobe sinc‐Gaussian or any other saturation pulses may be used in (B1) and (B2), and Fermi pulses in (B3). (C) Shorter pulse‐train RF saturation (T sat = 830 ms, B1rms = 2 μT) with high DCsat = 95%, which was proposed by Zhu et al. (D) Pulse‐train RF saturation (T sat = 2 s, B1rms = 2 μT) with standard DCsat = 50%. Single‐lobe sinc‐Gaussian saturation pulses are used as an example. (C) and (D) are not optimal, but have often been used previously. To exactly reproduce these pre‐saturation blocks, find their definition in the pulseq‐CEST library (A: APTw_000, B2: APTw_001, C: APTw_003, D: APTw_002)
FIGURE 6
FIGURE 6
Preliminary results of Z‐spectra, MTRasym spectra, and APTw images acquired from adult healthy volunteers on a GE 3 T MRI scanner (Discovery MR750) (A), a Philips 3 T MRI scanner (Ingenia) (B), and a Siemens 3 T MRI scanner (Prisma) (C), using the recommended RF saturation methods (Figure 5B3, B1, and B2), respectively. Comparable regions of interest were chosen in white matter (blue lines), cortex (red lines), and cerebrospinal fluid (CSF, purple lines). A single‐slice TSE/EPI acquisition was used in (A) and (B), respectively, and the 3D snapshot GRE (7 s per offset) in (C). Similar Z‐spectra, MTRasym spectra, and APTw images were obtained for the 3 different vendors, particularly for white matter and cortex. Z‐spectra and MTRasym spectra of CSF show relatively larger standard deviations, which can be attributable to flow‐related effects. The use of the fast 3D snapshot GRE in (C) is associated with the larger partial volume effect in the second phase‐encoding (head‐foot) direction (CSF Z‐spectrum) and hyperintense vessel signals (APTw image). Standard deviations are ROI‐based (over the number of voxels), and therefore, dominated by the ROI tissue‐based spatial inhomogeneity, and provide only coarse insight in the image CNR. Some B0 centering errors are visible in some of the CSF curves, leading to larger standard deviation close to the water frequency. Unpublished data from Drs. Phillip Zhe Sun and Yin Wu (GE System), Dr. Jinyuan Zhou (Philips System), and Dr. Moritz Zaiss (Siemens System). Studies were approved by the respective local Institutional Review Boards
FIGURE 7
FIGURE 7
3D APTw imaging sequence diagrams, all consisting of a pulse‐train RF saturation module, a SPIR lipid suppression pulse, and 3D image readout. (A) An example used in the Philips 3 T clinical MRI system. The time‐interleaved pTX‐based RF saturation module consists of 40 single‐lobe sinc‐Gaussian saturation pulses (50 ms each, T sat = 2 s, B1rms = 2 μT, DCsat = 100%), corresponding to Figure 5B1. The TSE readout module contains selective excitation and selective/non‐selective refocusing pulses (120°). (A) Made according to Keupp et al., , (B) An example used in a Siemens 3 T clinical MRI scanner. The RF saturation module consists of a train of 100‐ms‐long Gaussian pulses with a 10‐ms gap in between (DCsat = 91%), corresponding to Figure 5B2, and a 5‐ms‐long, 15‐mT/m‐strong crusher gradient is applied during the gap period. The SPACE readout module contains non‐selective excitation and refocusing pulses. The refocusing part has 4 startup pulses with flip angles of 149°, 122°, 119°, and 120°, and then executes constant 120° pulses. (B) Reproduced with permission from Zhang et al. (C) An example of the snapshot GRE CEST used in a Siemens 3 T clinical MRI scanner. The RF saturation module consists of a train of 36 50‐ms‐long Gaussian pulses with a 5‐ms gap in between (DCsat = 91%), corresponding to Figure 5B2, and a 2‐ms‐long, 15‐mT/m‐strong crusher gradient is applied after the preparation period. The snapshot GRE readout module contains slab‐selective, low flip‐angle excitation pulses of 5°‐7°. (C) Made according to Zaiss et al and Herz et al.
FIGURE 8
FIGURE 8
(A) A commonly used 6‐offset APTw protocol. During the preparation, localized shimming is performed. The optimal shim parameters and scanner's center frequency are determined and applied to the subsequent APTw data acquisition and ΔB0 mapping scans. During the APTw data acquisition, extra offsets (±3, ±4 ppm) are acquired to correct for spatial and temporal B0 inhomogeneities. Reproduced with permission from Zhou et al. (B) An APT‐Dixon method. The imaging is performed at frequency offsets ±3.1, ±3.5, ±3.9, and −1560 ppm (S 0). Image acquisition is repeated 3 times at +3.5 ppm. Acquisition windows and readout gradients are shifted (echo‐shift, [ES]) by +0.4 ms (ES1), 0 ms (ES2), and −0.4 ms (ES3) in each acquisition at +3.5 ppm for Dixon‐type ΔB0 mapping. Reproduced with permission from Togao et al.
FIGURE 9
FIGURE 9
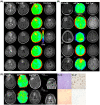
(A) An example of anatomic and APTw MR images for a patient with glioblastoma, isocitrate dehydrogenase (IDH) wild‐type. APTw images show hyperintensity in the Gd‐enhancing area, compared to the contralateral brain area. Five of 10 slices are shown. Unpublished data provided by Dr. Osamu Togao. The study was approved by the local institutional review board. (B) Five examples of anatomic and APTw MR images for patients with astrocytoma, IDH‐mutant, grade 2 (row i); oligodendroglioma, IDH‐mutant, 1p/19q codeletion, grade 2 (row ii); astrocytoma, IDH‐mutant, grade 3 (row iii); astrocytoma, IDH‐mutant, grade 4 (row iv); and glioblastoma, IDH‐wildtype, grade 4 (row v). Grade 3 or 4 gliomas typically show Gd enhancement and intermediate to high APTw hyperintensity. The 2021 World Health Organization classification of brain tumors was used. Unpublished data provided by Dr. Ji Eun Park. The study was approved by the local institutional review board. The recommended RF saturation method (Figure 5B1), 3D TSE readout, and APT‐Dixon method (Figure 8B) were used in (A) and (B). (C) Two examples of anatomic and APTw MR images, biopsied sites, and histology images from an APTw image‐guided stereotactic biopsy study, using the RF saturation method in Figure 5C, a 3D GRASE readout, and the 6‐offset APTw acquisition protocol from Figure 8A. (Top) A gliosarcoma patient with tumor recurrence, showing heterogeneous substantial APTw hyperintensity in the Gd‐enhancing area. The biopsied site marked by a screenshot had a high APTw signal (3.42%). (Bottom) A glioblastoma patient with treatment effect, showing homogeneous isointensity to minimal APTw hyperintensity in the gadolinium‐enhancing area. The biopsied site had a relatively low APTw signal (0.87%). Reproduced with permission from Jiang et al.
FIGURE 10
FIGURE 10
(A) Anatomic and APTw MR images for 2 patients with glioblastoma. (Top) An area of liquefactive necrosis (white arrow) is evident on standard anatomic MRI sequences. The APTw image shows that both the Gd‐enhancing tumor core and the proteinaceous fluid‐filled cavity (white arrow) have high APTw signal intensities. (Bottom) There is a large cavity filled with liquefactive necrosis (high FLAIR; white arrow) inside the tumor mass. T1w image demonstrates a small region of high signal intensities (red arrowhead) that is characteristic of hemorrhage. Both the tumor core and the liquefactive necrosis generally have high APTw signals, whereas the clot (red arrowhead) has a low APTw signal. Reproduced with permission from Wen et al. (B) MRI of hemorrhage metastasis. At the periphery, the lesion shows isointensity on the T1w image and hypointensity on the T2w image, both consistent with acute hemorrhage. However, the central portion of the lesion shows hyperintensity on both T1w and T2w images, consistent with late subacute hemorrhage. The APTw image demonstrates a higher signal in the acute hemorrhage region than in the subacute hemorrhage region. Reproduced with permission from Jeong et al. (C) Standard APTw and fluid‐suppressed APTw MR images for 2 patients with glioblastoma. (Top) A tumor with large central fluid content showing only thin rim enhancement after fluid suppression. (Bottom) A complex case with the significant cleanup of fluid APTw signals with fluid suppression. Reproduced with permission from Keupp and Togao. (D) Anatomic, dynamic susceptibility contrast‐enhanced perfusion‐weighted, and fluid‐suppressed APTw MR images in a patient with a histologically confirmed astrocytoma, IDH‐mutant, grade 4. The anatomic images demonstrate a heterogeneous lesion with a rather solid central and well‐enhancing part (black arrows), a peripheral compartment (arrowheads), and some T2w/FLAIR mismatch without overt enhancement. The area of strong enhancement also demonstrates strong neo‐vascularization as is evident on the leakage‐corrected relative cerebral blood volume (rCBV) map (orange arrow), whereas the peripheral lesion shows a very low vascularization index. The APTw images in different color‐coding show significantly elevated signal in the enhancing tumor, suggesting clearly high‐grade features. Interestingly, the anterior rim zone, along with a halo surrounding the enhancing area, demonstrates mildly elevated APTw signal (arrowheads) that indicates likely high‐grade tumor characteristics, which are not captured by the perfusion‐weighted MRI. The APTw image appears to provide a more accurate functional tumor mapping than the rCBV map in this case. Unpublished data provided by Drs. Sotirios Bisdas and Laura Mancini (University College London Hospitals NHS Foundation Trust and UCL Queen Square Institute of Neurology) from an ongoing study approved by the Institutional Review Board and the local ethics committee. The data were acquired on a Siemens 3 T Prisma scanner, using a 3D APTw protocol (DCsat = 91%, B1rms = 2 μT, T sat = 2 s) and water shift and B1 for B0 and B1 mapping. Perfusion, water shift and B1, and APTw data were processed in Olea Sphere 3.0 software (Olea Medical, La Ciotat, France)

References

    1. Zhou J, Payen J, Wilson DA, Traystman RJ, van Zijl PCM. Using the amide proton signals of intracellular proteins and peptides to detect pH effects in MRI. Nature Med. 2003;9:1085‐1090. - PubMed
    1. Zhou J, Lal B, Wilson DA, Laterra J, van Zijl PCM. Amide proton transfer (APT) contrast for imaging of brain tumors. Magn Reson Med. 2003;50:1120‐1126. - PubMed
    1. Ward KM, Aletras AH, Balaban RS. A new class of contrast agents for MRI based on proton chemical exchange dependent saturation transfer (CEST). J Magn Reson. 2000;143:79‐87. - PubMed
    1. Zhou J, van Zijl PC. Chemical exchange saturation transfer imaging and spectroscopy. Progr NMR Spectr. 2006;48:109‐136.
    1. Sherry AD, Woods M. Chemical exchange saturation transfer contrast agents for magnetic resonance imaging. Annu Rev Biomed Eng. 2008;10:391‐411. - PMC - PubMed

Publication types