

doi: 10.1002/ctm2.813.
Kindlin-1 modulates the EGFR pathway and predicts sensitivity to EGFR inhibitors across cancer types
Affiliations
- PMID: 35452191
- PMCID: PMC9029018
- DOI: 10.1002/ctm2.813
Item in Clipboard
Kindlin-1 modulates the EGFR pathway and predicts sensitivity to EGFR inhibitors across cancer types
Clin Transl Med.
2022 Apr.
No abstract available
Figures
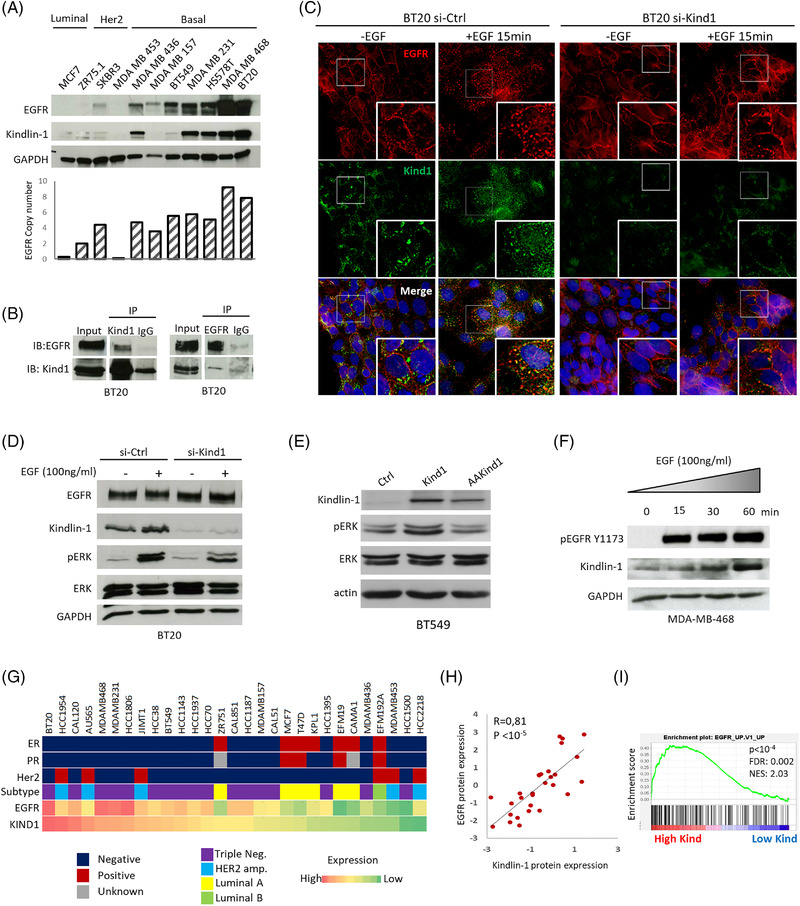
Kindlin‐1 interacts and colocalises with epidermal growth factor receptor (EGFR), promoting the EGFR pathway in breast cancer cells. (A) Western blots of Kindlin‐1 and EGFR in different breast cancer cell lines representing the different subtypes (Luminal, Her2 and Basal) of breast tumours. The EGFR copy number is shown for each cell line. (B) BT20 cells were immunoprecipitated with either normal rabbit IgG, as a negative control (IP: IgG), anti‐Kindlin‐1 (IP: Kind1) or anti‐EGFR (IP: EGFR) antibodies. Immunoprecipitates were examined by immunoblotting with anti‐EGFR and anti‐Kindlin‐1 antibodies. (C) BT20 cells were transfected with control siRNA (si‐Ctrl) or Kindlin‐1 siRNA (si‐Kind1). Seven days after transfection, the cells were starved overnight and then treated or not with 100 ng/ml EGF for 15 min. The cells were then immunostained with anti‐Kindlin‐1 (green) and anti‐EGFR (red) antibodies and counterstained with DAPI (original magnification: X100). (D) Cellular extracts corresponding to (C) were immunoblotted with anti‐EGFR, anti‐Kindlin‐1, anti‐phosphorylated extracellular signal‐regulated kinase (ERK), anti‐ERK and anti‐GAPDH (loading control) antibodies. (E) BT549 cells were stably transfected with wild‐type Kindlin‐1 (Kind1) or the mutant form of Kindlin‐1 deficient in β1‐integrin binding (AAKind; QW611/612AA mutations). Cell extracts were immunoblotted with anti‐Kindlin‐1, anti‐pERK, anti‐ERK and anti‐actin (loading control) antibodies. (F) MDA‐MB‐468 cells were starved overnight and treated with EGF (100 ng/ml) for the indicated times. Cellular extracts were immunoblotted with anti‐pEGFR, anti‐Kindlin‐1 and anti‐GAPDH antibodies. (G) EGFR and Kindlin‐1 protein expression in 29 breast cancer cell lines from CCLE. Estrogen receptor (ER), progesterone receptor (PR), Her2 status and breast cancer subtype have been reported. (H) Correlation between EGFR and Kindlin‐1 protein levels in CCLE cell lines presented in (G) (Spearman's rank correlation test). (I) Gene set enrichment analysis (GSEA) plot showing the enrichment of the EGFR pathway in CCLE cell lines (n = 58) categorised into high (n = 19) versus low (n = 39) Kindlin‐1 expression groups. FDR, false discovery rate q value; NES, normalised enrichment score
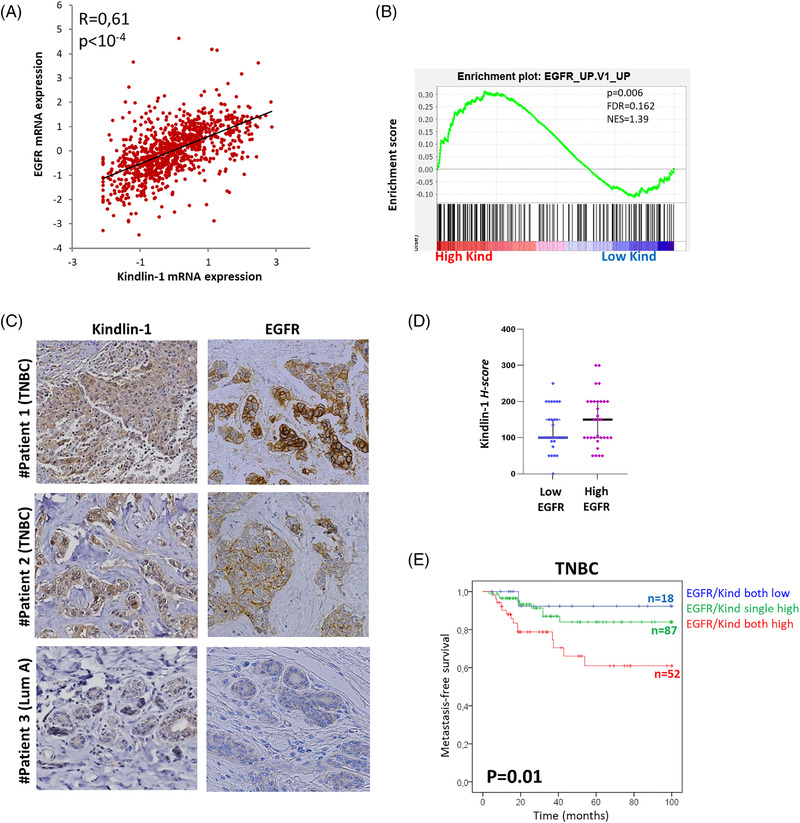
High Kindlin‐1 expression is associated with the epidermal growth factor receptor (EGFR) pathway in breast cancer cell lines and tumours. (A) Correlation between EGFR and Kindlin‐1 mRNA expression levels in 976 breast tumours from The Cancer Genome Atlas (TCGA) (Spearman's rank correlation test). (B) Gene set enrichment analysis (GSEA) plot showing the enrichment of the EGFR pathway in breast tumours from TCGA with high mRNA expression of Kindlin‐1 (n = 72/976). C. Kindlin‐1 and EGFR immunohistochemical staining in breast tumours from three different patients with luminal A (Lum A) or triple‐negative breast cancers (TNBCs). These tumours are representative cases of a series of 62 carcinomas from patients treated at the Curie Hospital. (D) Scatter plot showing Kindlin‐1 protein expression in the same series as in (D). Cases were categorised as low versus high EGFR protein expression. Each point represents the H‐score from a single tissue sample ranging from total absence of Kindlin‐1 in the epithelial compartment (H‐score 0) to very strong Kindlin‐1 staining (H‐score 300). (E) Kaplan–Meier curve showing metastasis‐free survival of TNBC patients with respect to EGFR and Kindlin‐1 expression. Patients were divided into three categories: low expression of both EGFR and Kindlin‐1 (blue line); single overexpression of EGFR or Kindlin‐1 (green line); concomitant overexpression of EGFR and Kindlin‐1 (red line) (log‐rank test)
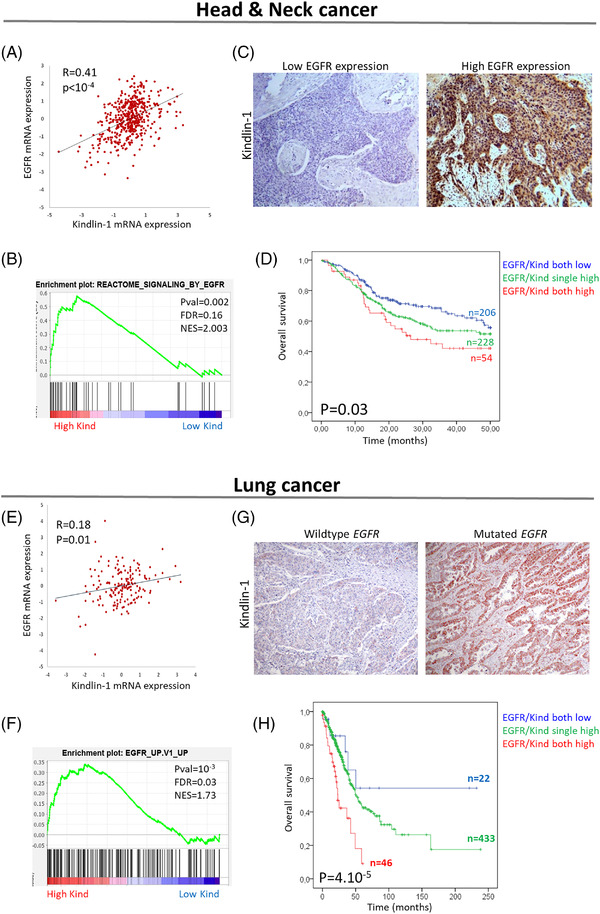
High Kindlin‐1 expression is associated with the epidermal growth factor receptor (EGFR) pathway in head and neck and lung tumors. (A) Correlation between EGFR and Kindlin‐1 mRNA expression levels in head and neck tumours from The Cancer Genome Atlas (TCGA) (n = 515) (Spearman's rank correlation test). (B) Gene set enrichment analysis (GSEA) plot showing the enrichment of the EGFR pathway in head and neck tumours with high mRNA expression of Kindlin‐1 (n = 64/515). (C) Representative images of Kindlin‐1 immunohistochemical staining in head and neck tumours presenting high or low levels of EGFR. (D) Kaplan–Meier plots showing the overall survival of TCGA head and neck squamous cell carcinoma (HNSCC) with respect to EGFR and Kindlin‐1 expression. (E) Correlation between EGFR and Kindlin‐1 mRNA expression levels in lung tumours from OncoSG (n = 169) (Spearman's rank correlation test). (F) GSEA plot showing the enrichment of the EGFR pathway in lung tumours with high mRNA expression of Kindlin‐1 (n = 36/169). (G) Representative images of Kindlin‐1 immunohistochemical staining in lung tumours wild‐type for the EGFR gene or harbouring an EGFR mutation. (H) Kaplan–Meier plots showing the overall survival of TCGA lung cancer patients with respect to EGFR and Kindlin‐1 expression. For Kaplan–Meier analyses, patients were divided into three categories: low expression of both EGFR and Kindlin‐1 (blue line); single overexpression of EGFR or Kindlin‐1 (green line); concomitant overexpression of EGFR and Kindlin‐1 (red line) (log‐rank test)
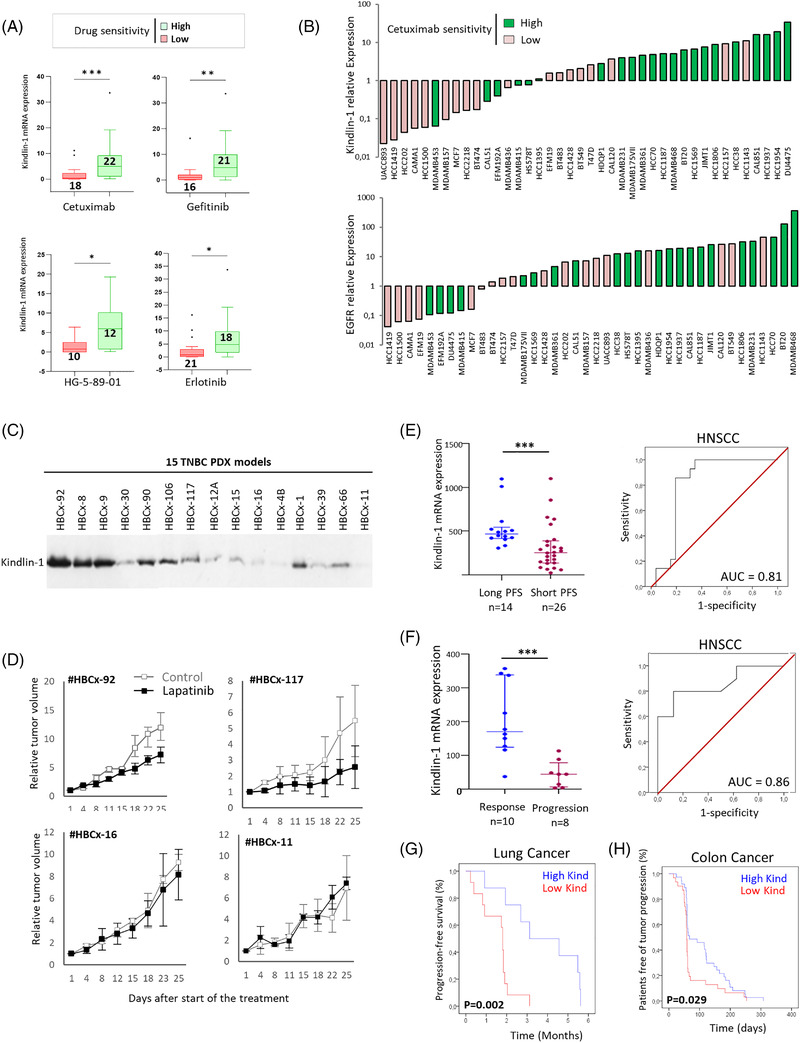
Kindlin‐1 expression is predictive of the response to epidermal growth factor receptor (EGFR) inhibitors. (A) Box and whisker plots representing the differential mRNA expression levels of Kindlin‐1 in breast cancer cells with low versus high sensitivity to cetuximab (P = 00009), gefitinib (P = 0015), HG‐5‐89‐01 (P = 0,02) and erlotinib (P = 0013) (Mann–Whitney test). (B) Relative Kindlin‐1 or EGFR expression in 40 breast cancer cell lines from the CCLE classified into high (n = 22) or low (n = 18) sensitivity to cetuximab depending on their IC50 values as reported in the Genomics of Drug Sensitivity in Cancer database (chi square test, P = 0.001 and P = 0.02, respectively). (C) Western blot showing Kindlin‐1 protein expression in a series of 15 triple‐negative breast cancer (TNBC) patient‐derived xenograft (PDX) models. (D) Graphs showing relative tumour growth after lapatinib treatment of two PDX models highly expressing Kindlin‐1 (#HBCx‐92 and # HBCx‐117) and two PDX models with low Kindlin‐1 expression (#HBCx‐16 and # HBCx‐11). (E) Scatter plot representing the differential mRNA expression levels of Kindlin‐1 in a dataset of 40 HNSCC patients (GSE65021), dichotomised into long (progression‐free survival [PFS] > 12 months, n = 14) and short (PFS < 5.6 months, n = 26) PFS after undergoing first‐line CT and cetuximab‐based combination therapy (Mann–Whitney test, P = 0.0008). Receiver operating characteristic (ROC) curve assessing the performance of Kindlin‐1 in the cohort of 40 head and neck squamous cell carcinoma (HNSCC) patients. (F) Scatter plot representing the differential mRNA expression levels of Kindlin‐1 in a series of 18 HNSCC patients from Institut Curie, dichotomised into response (n = 10) and progression (n = 8) after undergoing cetuximab monotherapy (Mann–Whitney test, P = 0.0008). The ROC curve corresponding to this latter HNSCC cohort resulted in an area under the curve (AUC) of 0.86. (G) Kaplan–Meier plot showing the PFS (%) of 20 non‐small cell lung cancer (NSCLC) cancer patients treated with erlotinib (both EGFR and KRAS wild‐type) from the BATTLE study (GSE33072, log‐rank test). (H) Kaplan–Meier plot showing the patient‐free survival of tumour progression (%) from a series of 68 metastatic colorectal cancer patients enrolled in a cetuximab monotherapy trial (GSE5851, log‐rank test)
References
-
- Sin S, Bonin F, Petit V, Meseure D, et al. Role of the Focal Adhesion Protein Kindlin‐1 in Breast Cancer Growth and Lung Metastasis. JNCI: Journal of the National Cancer Institute. 2011;103(17):1323–37. - PubMed
Publication types
MeSH terms
Substances
LinkOut - more resources
Full Text Sources
Medical
Molecular Biology Databases
Research Materials
Miscellaneous