. 2022 Apr 22;8(16):eabm3453.
doi: 10.1126/sciadv.abm3453. Epub 2022 Apr 22.

Single-EV analysis (sEVA) of mutated proteins allows detection of stage 1 pancreatic cancer

Affiliations

Single-EV analysis (sEVA) of mutated proteins allows detection of stage 1 pancreatic cancer

Scott Ferguson et al. Sci Adv. .

Abstract

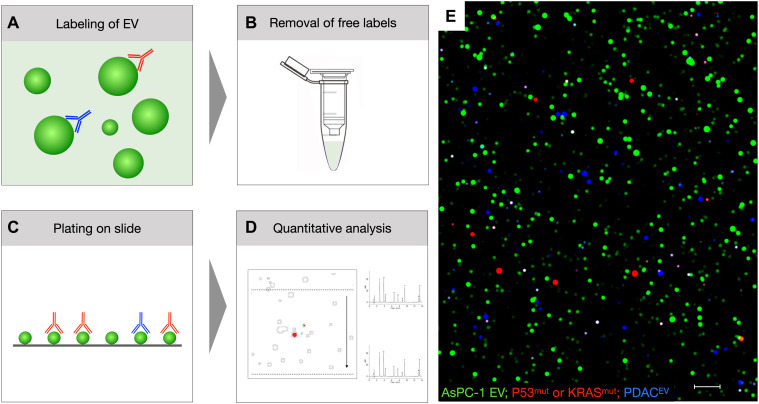
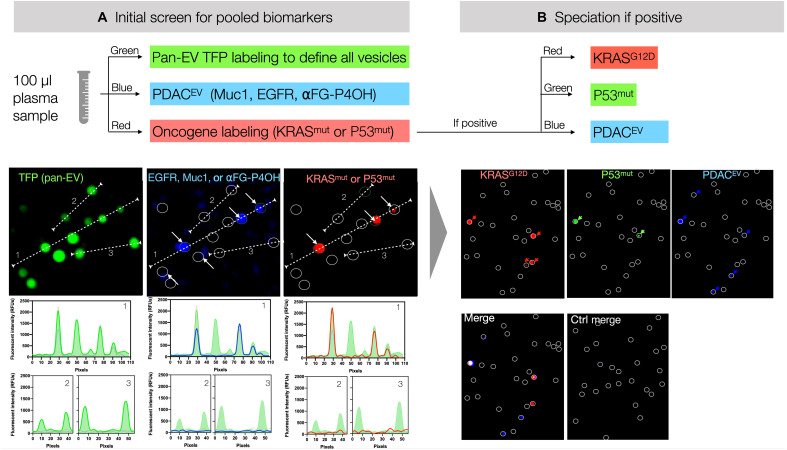
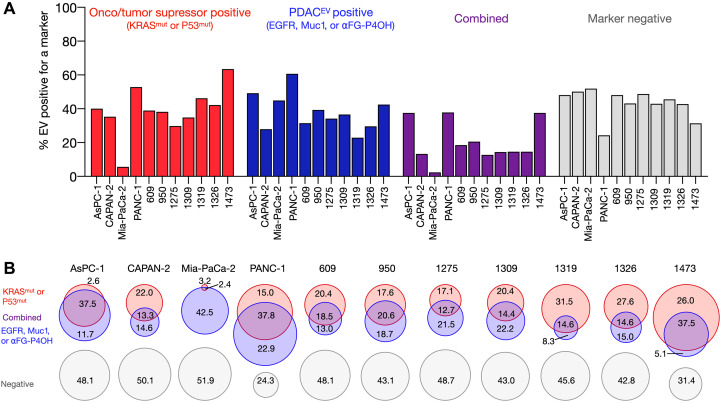
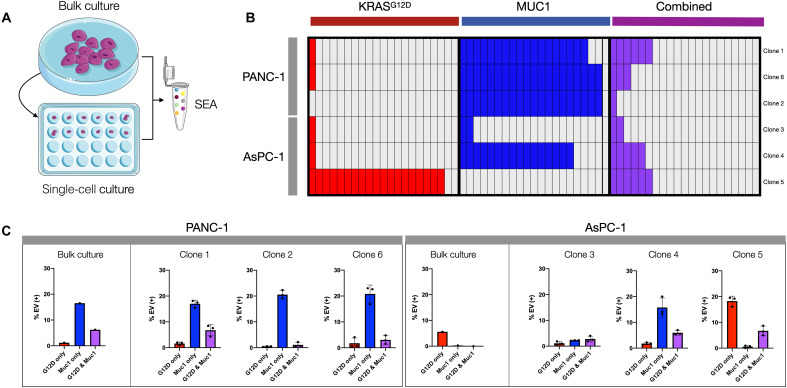
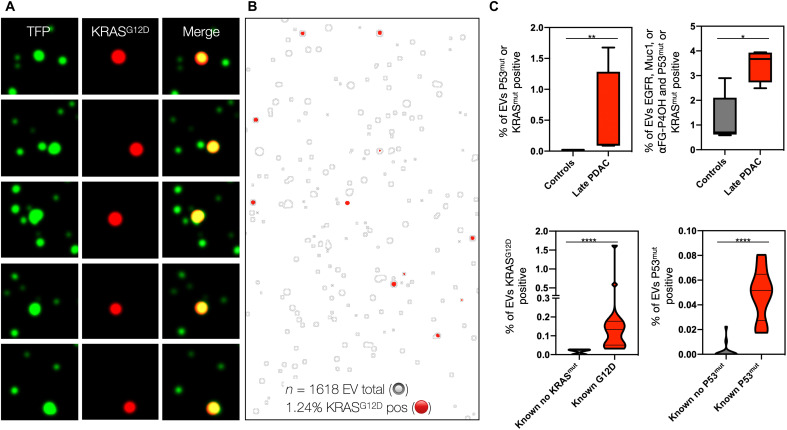
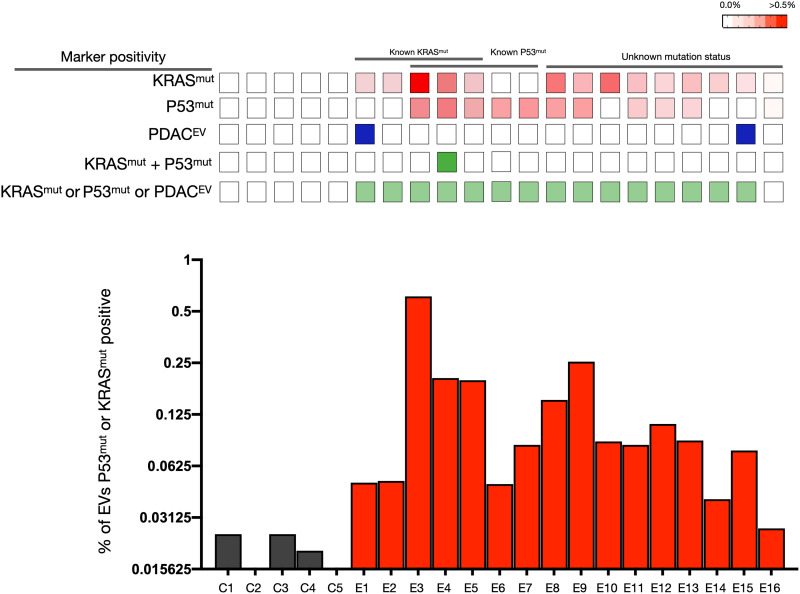
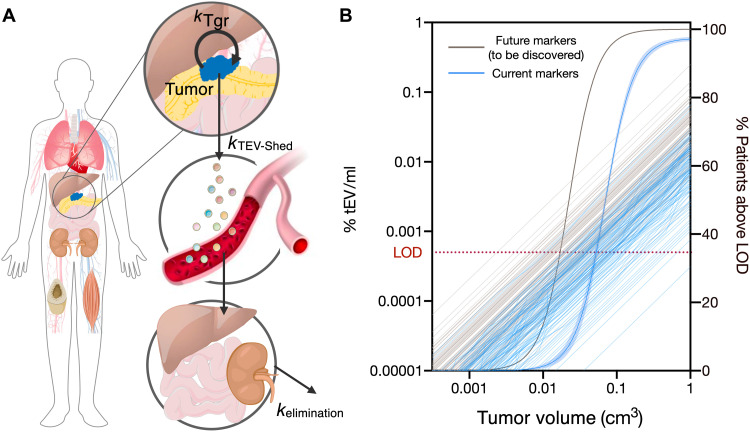
Tumor cell-derived extracellular vesicles (EVs) are being explored as circulating biomarkers, but it is unclear whether bulk measurements will allow early cancer detection. We hypothesized that a single-EV analysis (sEVA) technique could potentially improve diagnostic accuracy. Using pancreatic cancer (PDAC), we analyzed the composition of putative cancer markers in 11 model lines. In parental PDAC cells positive for KRASmut and/or P53mut proteins, only ~40% of EVs were also positive. In a blinded study involving 16 patients with surgically proven stage 1 PDAC, KRASmut and P53mut protein was detectable at much lower levels, generally in <0.1% of vesicles. These vesicles were detectable by the new sEVA approach in 15 of the 16 patients. Using a modeling approach, we estimate that the current PDAC detection limit is at ~0.1-cm3 tumor volume, below clinical imaging capabilities. These findings establish the potential for sEVA for early cancer detection.


Figures

Fig. 1.
Fig. 1.. Overview of sEVA.
(A) EVs are labeled in solution with (i) the protein-reactive TFP dye (green) and (ii) biomarker-specific fluorescent antibodies [red, far red (shown in blue)]. (B) Following purification to remove unbound TFP and fluorescent antibodies, the EVs are (C) pipetted onto hydrophobic glass sides and (D and E) imaged and then analyzed. See fig. S1 for details on labeling and fig. S2 for the computational analysis pipeline. The image in (E) represents an example of AsPC-1 EV stained with TFP-AF488 (green) to label all EV KRASmut or P53mut (red channel) and EGFR, MUC1, and/or FG-P4OH (blue; scale bar, 1 μm).
Fig. 2.
Fig. 2.. Workflow of sEVA.
(A) In an initial screen, EVs are labeled for pooled biomarkers as shown. For example, onco/tumor suppressor gene labeling contains three antibodies labeled with the same fluorochrome (KRASG12D, KRASG12V, and P53mut; red channel); additional pancreatic cancer markers (EGFR, MUC1, and α FG-P4OH) are shown in the blue channel. Note the high signal-to-noise ratio of labeling individual EV as shown in the dashed lines (e.g., 1, 2, or 3). (B) In case of positivity, any of the channels can be subspeciated, where each antibody contains a separate fluorochrome as shown. RFU, relative fluorescence units.
Fig. 3.
Fig. 3.. sEVA analysis across multiple PDAC cell line–derived EVs.
(A) Summary graph of the % EVs that stain for (i) KRASmut or P53mut (red); (ii) EGFR, MUC1, or FG-P4OH (blue); (iii) at least one of each of the former two marker panels (purple); or (iv) no marker (gray). The sum of EV was determined by pan-TFP labeling. Each column represents a different cell line or PDX line (see table S1 for characteristics of parental cells). (B) Data plotted in Venn diagrams to show EV distribution across cell lines. Note the often large fraction of EV negative for any marker.
Fig. 4.
Fig. 4.. Clonal EV analysis.
(A) A serial dilution was performed to obtain single-cell isolates from bulk cultures of PANC-1 and AsPC-1 cells. EVs were then collected from the medium of the resulting clonal expansion culture and compared to EVs from the parent cell lines. (B) The clone-derived EVs were analyzed for expression of KRASG12D and MUC1. Each box represents 1% of total EV staining for either marker alone or dual positive for both (purple). (C) Different PANC-1 clones appeared similar to each other and the parental line. Conversely, AsPC-1 clones showed variable expression of KRASG12D and MUC1 in EV. The EV formation rate was similar among clones, indicating that observed differences are due to differential clonal endogenous expression.
Fig. 5.
Fig. 5.. EV-based KRASG12D detection in clinical plasma sample.
(A) Representative images of a stage 4 PDAC, demonstrating superb colocalization of KRASG12D staining with TFP-labeled EV (green). Note that the bulk EV analysis of this sample failed to detect KRASmut. (B) Larger FOV of the same plasma sample. In this image, the TFP-ROI mask of all labeled EV is depicted by gray outlines, while the KRASG12D staining is shown in red. Of 1618 EVs imaged (only a fraction is shown for better visibility), 1.24% were positive for KRASG12D. (C) Group analysis of EV. The top graphs show quantitative analysis of late-stage PDAC samples (n = 4) against controls (n = 5). Note the high levels of EV positivity for KRASmut/P53mut as well as other PDAC biomarkers. The bottom graphs show the correlation of EV positivity for KRASmut/P53mut against the known mutational status derived from sequencing of surgical tumor samples (n = 24 samples). P values were indicated by significance: 0.0332 (*), 0.0021 (**), 0.0002 (***), and <0.0001 (****). Note the excellent correlation between EV analysis and NGS results. See text for details.
Fig. 6.
Fig. 6.. sEVA of clinical stage 1 PDAC cases.
Analysis of KRASmut and P53mut in EV of stage 1 PDAC plasma samples (n = 16) and in healthy controls (n = 5). Note that virtually all stage 1 PDAC plasma samples contained EV positive for either KRASmut (row 1) or P53mut (row 2). This marker positivity is higher than for PDACEV alone (row 3), as only two samples were above background. We also determined the fraction of EV double positive for both KRASmut and P53mut (row 4) in an effort to increase specificity, but this was a rare event. When all markers were combined, 15 of the 16 samples had positive EV (row 5). The bottom graph shows the fraction of KRASmut- or P53mut-positive EV in plasma samples.
Fig. 7.
Fig. 7.. Modeling of PDAC cancer detection using plasma sEVA.
(A) A model of tumor-EV production, distribution, and elimination (56) was combined with additional measurements of EV shed rates and the newly measured percent of EV positive for tumor-specific markers to (B) simulate current detection limits of PDAC tumors across a population of variable tEV shed rates and with variable percent coverage of tumor markers on the shed tEV. With the current set of markers shown in Fig. 6, ~70% of PDACs are estimated to become detectable at a tumor volume of 0.1 cm3. With additional robust markers, this detection level could approach 97%. LOD, limit of detection.

References

    1. Rahib L., Smith B. D., Aizenberg R., Rosenzweig A. B., Fleshman J. M., Matrisian L. M., Projecting cancer incidence and deaths to 2030: The unexpected burden of thyroid, liver, and pancreas cancers in the United States. Cancer Res. 74, 2913–2921 (2014). - PubMed
    1. Ferrone C. R., Marchegiani G., Hong T. S., Ryan D. P., Deshpande V., McDonnell E. I., Sabbatino F., Santos D. D., Allen J. N., Blaszkowsky L. S., Clark J. W., Faris J. E., Goyal L., Kwak E. L., Murphy J. E., Ting D. T., Wo J. Y., Zhu A. X., Warshaw A. L., Lillemoe K. D., Fernández-del Castillo C., Radiological and surgical implications of neoadjuvant treatment with FOLFIRINOX for locally advanced and borderline resectable pancreatic cancer. Ann. Surg. 261, 12–17 (2015). - PMC - PubMed
    1. Mattox A. K., Bettegowda C., Zhou S., Papadopoulos N., Kinzler K. W., Vogelstein B., Applications of liquid biopsies for cancer. Sci. Transl. Med. 11, eaay1984 (2019). - PubMed
    1. Krantz B. A., O’Reilly E. M., Biomarker-based therapy in pancreatic ductal adenocarcinoma: An emerging reality. Clin. Cancer Res. 24, 2241–2250 (2018). - PMC - PubMed
    1. Bettegowda C., Sausen M., Leary R. J., Kinde I., Wang Y., Agrawal N., Bartlett B. R., Wang H., Luber B., Alani R. M., Antonarakis E. S., Azad N. S., Bardelli A., Brem H., Cameron J. L., Lee C. C., Fecher L. A., Gallia G. L., Gibbs P., Le D., Giuntoli R. L., Goggins M., Hogarty M. D., Holdhoff M., Hong S. M., Jiao Y., Juhl H. H., Kim J. J., Siravegna G., Laheru D. A., Lauricella C., Lim M., Lipson E. J., Marie S. K., Netto G. J., Oliner K. S., Olivi A., Olsson L., Riggins G. J., Sartore-Bianchi A., Schmidt K., Shih L. M., Oba-Shinjo S. M., Siena S., Theodorescu D., Tie J., Harkins T. T., Veronese S., Wang T. L., Weingart J. D., Wolfgang C. L., Wood L. D., Xing D., Hruban R. H., Wu J., Allen P. J., Schmidt C. M., Choti M. A., Velculescu V. E., Kinzler K. W., Vogelstein B., Papadopoulos N., Diaz L. A., Detection of circulating tumor DNA in early- and late-stage human malignancies. Sci. Transl. Med. 6, 224ra24 (2014). - PMC - PubMed

MeSH terms

Substances