. 2022 Apr 22;8(16):eabl9250.
doi: 10.1126/sciadv.abl9250. Epub 2022 Apr 22.

Novel quantification of regional fossil fuel CO2 reductions during COVID-19 lockdowns using atmospheric oxygen measurements

Affiliations

Novel quantification of regional fossil fuel CO2 reductions during COVID-19 lockdowns using atmospheric oxygen measurements

Penelope A Pickers et al. Sci Adv. .

Abstract

It is not currently possible to quantify regional-scale fossil fuel carbon dioxide (ffCO2) emissions with high accuracy in near real time. Existing atmospheric methods for separating ffCO2 from large natural carbon dioxide variations are constrained by sampling limitations, so that estimates of regional changes in ffCO2 emissions, such as those occurring in response to coronavirus disease 2019 (COVID-19) lockdowns, rely on indirect activity data. We present a method for quantifying regional signals of ffCO2 based on continuous atmospheric measurements of oxygen and carbon dioxide combined into the tracer "atmospheric potential oxygen" (APO). We detect and quantify ffCO2 reductions during 2020-2021 caused by the two U.K. COVID-19 lockdowns individually using APO data from Weybourne Atmospheric Observatory in the United Kingdom and a machine learning algorithm. Our APO-based assessment has near-real-time potential and provides high-frequency information that is in good agreement with the spread of ffCO2 emissions reductions from three independent lower-frequency U.K. estimates.


Figures
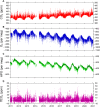
Fig. 1.
Fig. 1.. Hourly atmospheric CO2, O2, and APO observations and calculated ffCO2 from the WAO, 2011–2021.
(A) Atmospheric CO2 in parts per million. (B) Atmospheric O2 in per meg units. A 1-ppm change in CO2 is equivalent to a 4.77–per meg change in O2 (38). (C) APO, also in per meg units. The black points in (C) are the statistically determined “baseline,” i.e., the APOBL term in Eq. 1. (D) ffCO2, calculated from APO by removing the baseline signal in (C) from the APO observations and dividing by RAPO as in Eq. 1. The black dashed line denotes “zero” ffCO2, which is defined as the statistically determined baseline APO concentration. (A) to (C) show seasonality that is driven mostly by terrestrial biospheric processes (CO2 and O2) and oceanic processes (O2 and APO). Shorter-term variability in all panels is driven by diurnal processes, changes in meteorological conditions, synoptic-scale variability, and ffCO2 emissions. Gaps in the data are caused by instrument downtimes. x axis tick labels denote the beginning of the year shown.
Fig. 2.
Fig. 2.. Cumulative daily ffCO2 from APO in parts per million × days observed at WAO.
Nonpandemic years (2011 to 2019) are shown by the thinner colored lines, except for the year 2014, which is omitted because of large gaps in the data. The year 2020, during which the COVID-19 pandemic started, is shown by the thicker red line. The influence of gaps on the cumulative signals have been accounted for by adjusting the ffCO2 by the proportion of days that are missing data in each year. The 29 February has similarly been excluded where relevant, to allow a fair comparison between leap and nonleap years.
Fig. 3.
Fig. 3.. Reduction in WAO ffCO2 associated with COVID-19 lockdowns.
(A) Differences in ffCO2 [as ffCO2 determined from APO minus modeled ffCO2 determined from a random forest machine learning (ML) algorithm], shown as weekly differences. The first and second U.K. COVID-19 waves are indicated by the gray background shading. Differences for the individual years 2011–2019 are show in blue. The period February 2020 to January 2021 is shown in red. All units are parts per million; x-axis major tick marks denote the first day of the month. Uncertainties are omitted from this panel for clarity. (B) Same as (A), but shown as cumulative daily-averaged ffCO2 in units of parts per million × days. The thick blue line indicates the 2011–2019 mean. Uncertainties are as follows: The blue shading is the ±2σ (95%) SD of the 2011–2019 mean, shown by the thick blue line, and represents the uncertainty of the training model (i.e., if the model performance was perfect, then the blue lines would all be zero), which, in part, arises from the long-term decreasing trend in U.K. emissions over the period 2011–2019; ffCO2 uncertainty for February 2020 onward is shown by the pale red shading and arises from the poorer performance of the predictive model relative to the training model (see the “Analysis of uncertainties” section for details). For comparison with our ffCO2[APO] detected COVID-19 signal, we also show 2020–2019 differences from three bottom-up U.K. emissions estimates (black lines) on the right-hand axis in units of MtCO2 (see Materials and Methods). Only the UEA value (black dashed line) includes an estimate of uncertainty, shown by the vertical error bar.
Fig. 4.
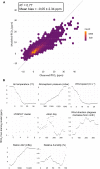
Fig. 4.. Evaluation of random forest machine learning model.
(A) Scatter plot of hourly observed versus modeled ffCO2 from the random forest model (2010–2019 only), showing the mean of the differences ±1σ SD. The plot is created using data from the model test set only, which are withheld from model training. The black line represents a 1:1 relationship. Observed ffCO2 is calculated using the APO approach (see Materials and Methods). The model underestimates the true range of variability of the APO-based ffCO2 but generally performs well. A histogram of the differences is shown in fig. S4. (B) Partial dependence plot of the key independent variables of the trained random forest model. The plots show the relationship between each independent variable and modeled ffCO2 (from the trained model) and therefore provide insight into how variables are being used in the predictive model (39). See fig. S5 for the HYSPLIT cluster key.
Fig. 5.
Fig. 5.. Results of the random forest prediction using atmospheric CO2 data.
The years 2011–2019 are shown by the black lines. The year 2020 is shown by the red line, with ±40% uncertainty of the machine learning prediction indicated by the red shading. The uncertainty of the daily CO2 observations themselves is not shown, since this is extremely small (typical hourly uncertainties are less than ±0.1 ppm).

References

    1. IEA, International Energy Agency World Energy Outlook 2008 (2008), chap. 8, pp. 179–193 .
    1. Peters G. P., le Quéré C., Andrew R. M., Canadell J. G., Friedlingstein P., Ilyina T., Jackson R. B., Joos F., Korsbakken J. I., McKinley G. A., Sitch S., Tans P., Towards real-time verification of CO2 emissions. Nat. Clim. Chang. 7, 848–850 (2017).
    1. Le Quéré C., Jackson R. B., Jones M. W., Smith A. J. P., Abernethy S., Andrew R. M., De-Gol A. J., Willis D. R., Shan Y., Canadell J. G., Friedlingstein P., Creutzig F., Peters G. P., Temporary reduction in daily global CO2 emissions during the COVID-19 forced confinement. Nat. Clim. Chang. 10, 647–653 (2020).
    1. Liu Z., Ciais P., Deng Z., Lei R., Davis S. J., Feng S., Zheng B., Cui D., Dou X., Zhu B., Guo R., Ke P., Sun T., Lu C., He P., Wang Y., Yue X., Wang Y., Lei Y., Zhou H., Cai Z., Wu Y., Guo R., Han T., Xue J., Boucher O., Boucher E., Chevallier F., Tanaka K., Wei Y., Zhong H., Kang C., Zhang N., Chen B., Xi F., Liu M., Bréon F. M., Lu Y., Zhang Q., Guan D., Gong P., Kammen D. M., He K., Schellnhuber H. J., Near-real-time monitoring of global CO2 emissions reveals the effects of the COVID-19 pandemic. Nat. Commun. 11, 5172 (2020). - PMC - PubMed
    1. Friedlingstein P., O’Sullivan M., Jones M. W., Andrew R. M., Hauck J., Olsen A., Peters G. P., Peters W., Pongratz J., Sitch S., le Quéré C., Canadell J. G., Ciais P., Jackson R. B., Alin S., Aragão L. E. O. C., Arneth A., Arora V., Bates N. R., Becker M., Benoit-Cattin A., Bittig H. C., Bopp L., Bultan S., Chandra N., Chevallier F., Chini L. P., Evans W., Florentie L., Forster P. M., Gasser T., Gehlen M., Gilfillan D., Gkritzalis T., Gregor L., Gruber N., Harris I., Hartung K., Haverd V., Houghton R. A., Ilyina T., Jain A. K., Joetzjer E., Kadono K., Kato E., Kitidis V., Korsbakken J. I., Landschützer P., Lefèvre N., Lenton A., Lienert S., Liu Z., Lombardozzi D., Marland G., Metzl N., Munro D. R., Nabel J. E. M. S., Nakaoka S. I., Niwa Y., O’Brien K., Ono T., Palmer P. I., Pierrot D., Poulter B., Resplandy L., Robertson E., Rödenbeck C., Schwinger J., Séférian R., Skjelvan I., Smith A. J. P., Sutton A. J., Tanhua T., Tans P. P., Tian H., Tilbrook B., van der Werf G., Vuichard N., Walker A. P., Wanninkhof R., Watson A. J., Willis D., Wiltshire A. J., Yuan W., Yue X., Zaehle S., Global carbon budget 2020. Earth Syst. Sci. Data 12, 3269–3340 (2020).