. 2022 Apr 22;8(16):eabj5227.
doi: 10.1126/sciadv.abj5227. Epub 2022 Apr 22.

A dominant function of LynB kinase in preventing autoimmunity

Affiliations

A dominant function of LynB kinase in preventing autoimmunity

Ben F Brian 4th et al. Sci Adv. .

Abstract

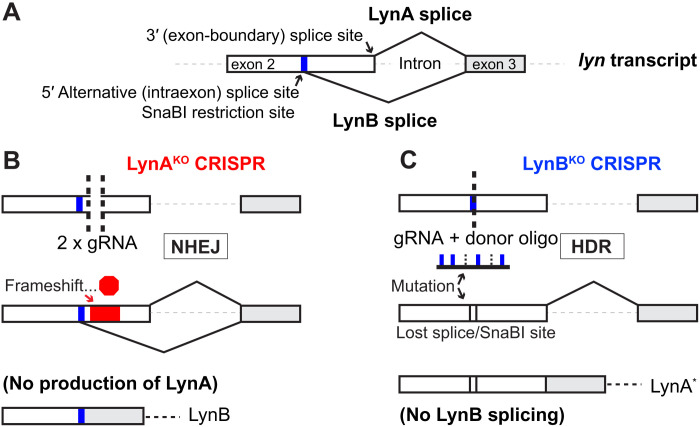
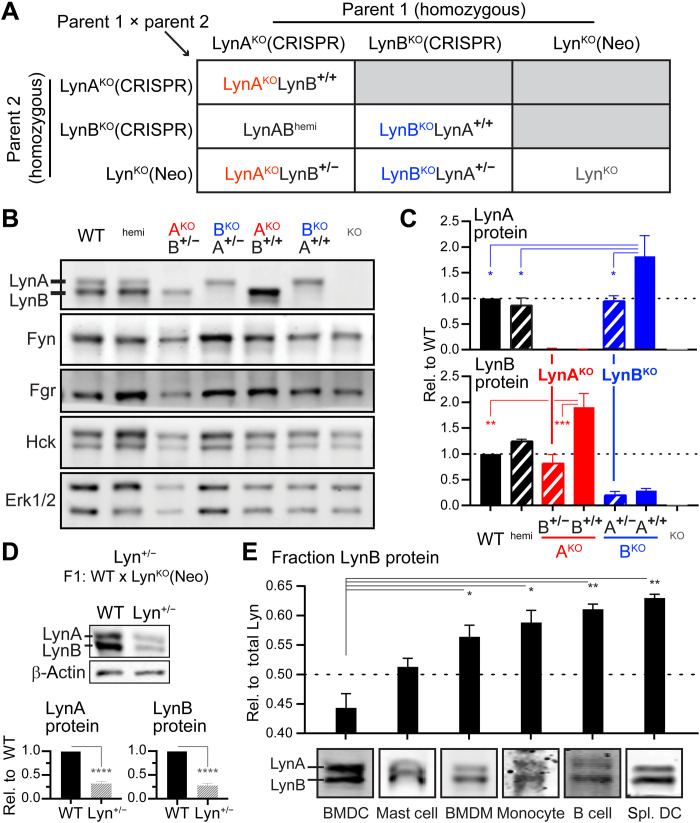
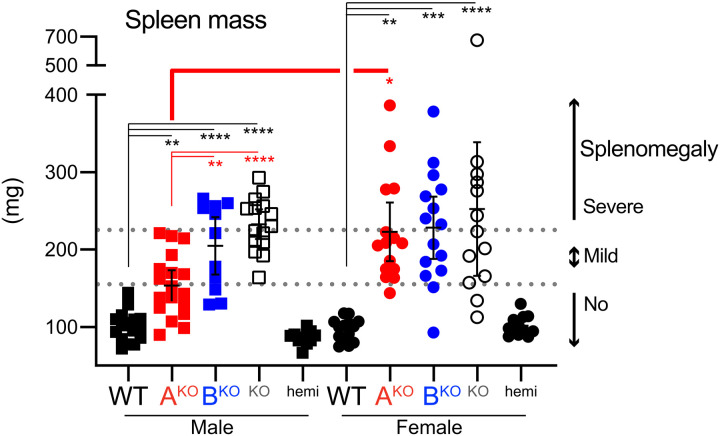
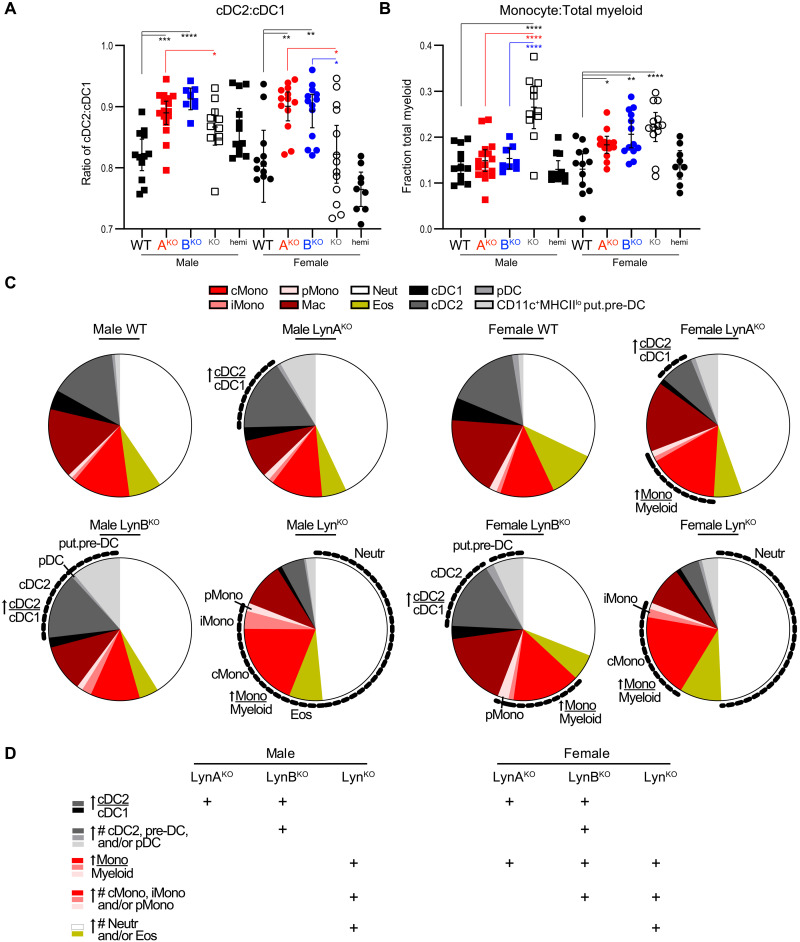
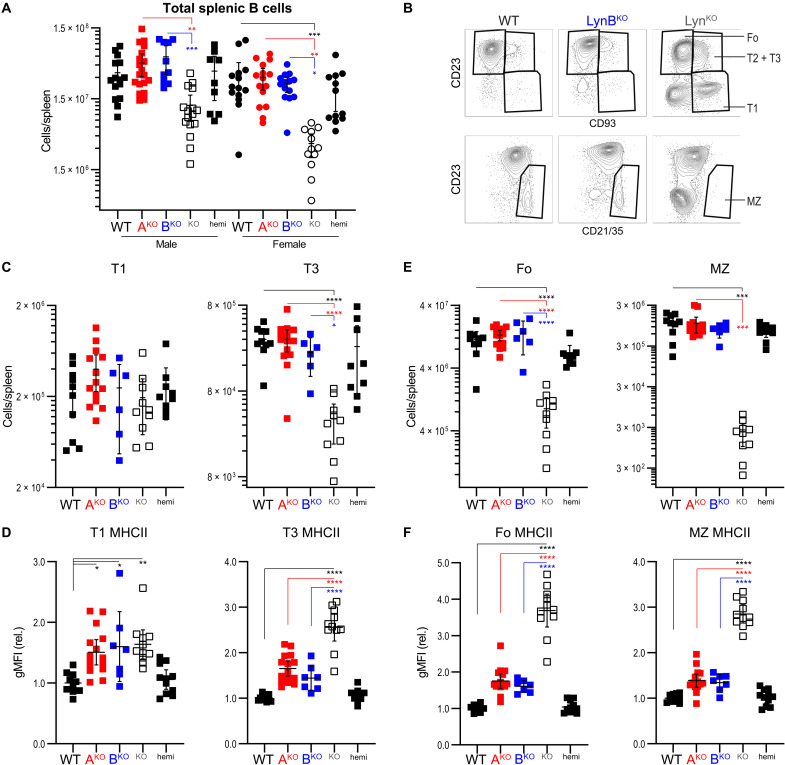
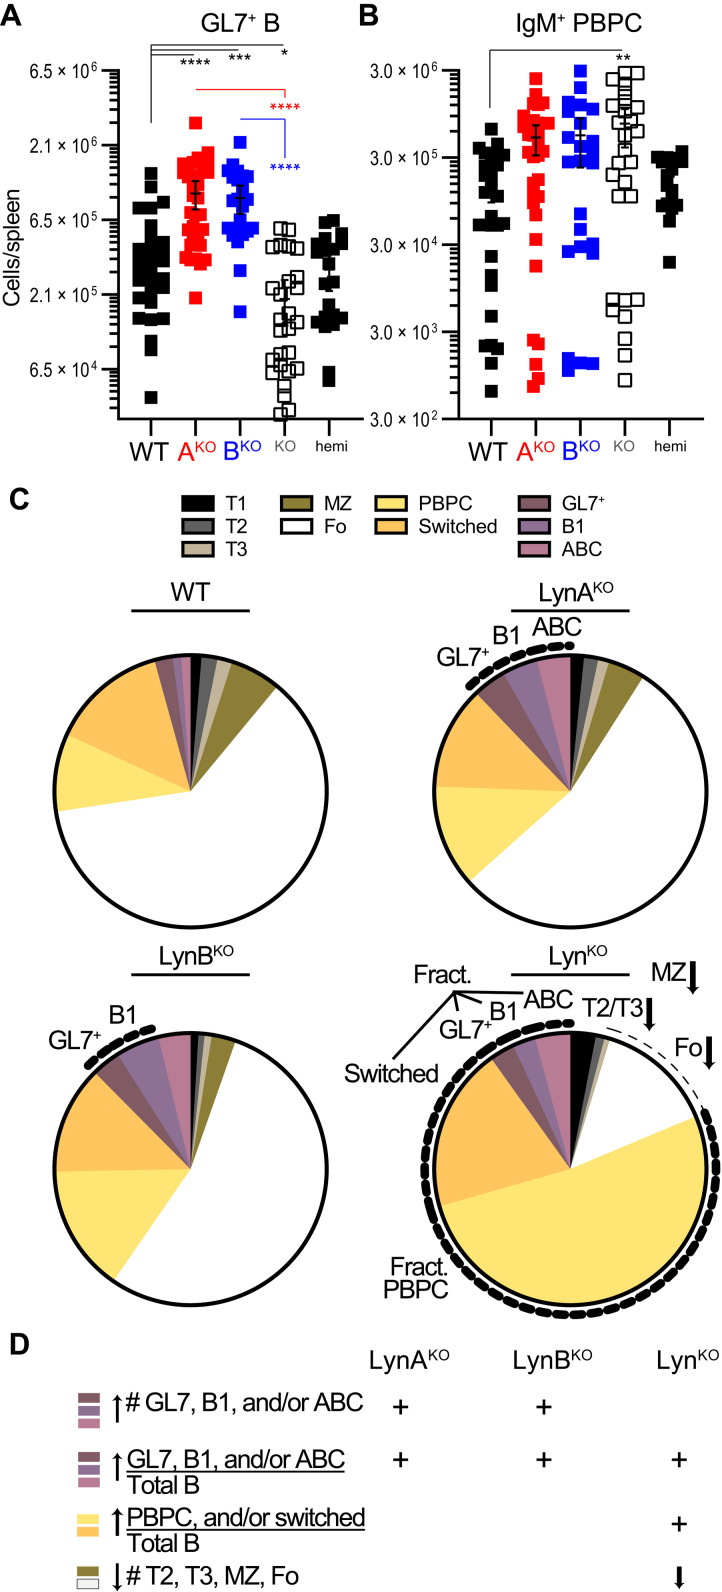
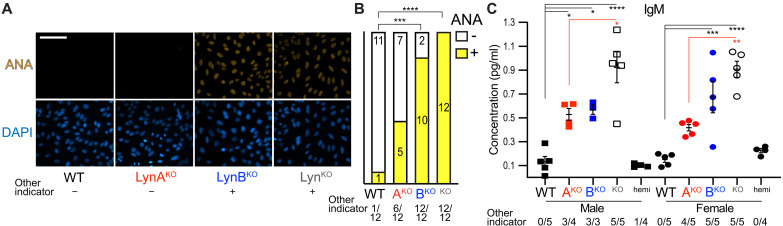
Here, we report that the LynB splice variant of the Src-family kinase Lyn exerts a dominant immunosuppressive function in vivo, whereas the LynA isoform is uniquely required to restrain autoimmunity in female mice. We used CRISPR-Cas9 gene editing to constrain lyn splicing and expression, generating single-isoform LynA knockout (LynAKO) or LynBKO mice. Autoimmune disease in total LynKO mice is characterized by production of antinuclear antibodies, glomerulonephritis, impaired B cell development, and overabundance of activated B cells and proinflammatory myeloid cells. Expression of LynA or LynB alone uncoupled the developmental phenotype from the autoimmune disease: B cell transitional populations were restored, but myeloid cells and differentiated B cells were dysregulated. These changes were isoform-specific, sexually dimorphic, and distinct from the complete LynKO. Despite the apparent differences in disease etiology and penetrance, loss of either LynA or LynB had the potential to induce severe autoimmune disease with parallels to human systemic lupus erythematosus (SLE).


Figures

Fig. 1.
Fig. 1.. Generation of LynAKO and LynBKO mice.
(A) Locations of LynA and LynB splice junctions in WT lyn transcript; a SnaBI restriction site is situated near the LynB splice donor in exon 2. (B) Generating LynAKO via NHEJ after double cutting within the LynA insert. (C) Generating LynBKO via HDR from a point-mutated donor oligonucleotide template.
Fig. 2.
Fig. 2.. SFK expression in LynAKO and LynBKO mice.
(A) Breeding scheme showing parental CRISPR and neomycin (Neo) (53) knockouts. LynAKOLynB+/+ progeny have biallelic expression of LynB, whereas LynAKOLynB+/− have monoallelic expression of LynB; allelic expression is reversed in the LynBKO series. (B) Immunoblot showing SFK expression in WT, (LynAB)hemi, (Lyn)AKO, (Lyn)BKO, and (total Lyn)KO BMDMs; Erk1/2 shows protein loading. (C) Quantification of LynA and LynB protein in BMDMs from male and female mice, corrected for total protein staining (74) and background in LynKO, reported relative to WT. Residual LynB signal in LynBKO was caused by LynA bleed-through. Error bars are SEM from at least three independent experiments (n = 3 to 5). Unless otherwise specified, significance: one-way ANOVA with Tukey’s multiple comparisons test, ****P < 0.0001, ***P < 0.002, **P < 0.01, and *P < 0.05. Not annotated: In the Lyn(B or A) quantifications, [WT/LynABhemi] versus [Lyn(A or B)KO/LynKO] pairs were significantly different. Other pairs were not significant. WT and CskAS BMDMs were both used in this analysis. (D) Total Lyn protein expression in WT and Lyn+/− BMDMs, corrected as above; in this and other figures, β-actin shows protein loading. Significance: unpaired t test; error bars: SEM (n = 4). (E) Relative LynB protein content in immune cells, with representative immunoblot images for BMDCs, bone marrow–derived mast cells, BMDMs, peripheral blood monocytes, splenic B cells, and splenic DCs (Spl. DC). Error bars: SEM (n = 3 to 13).
Fig. 3.
Fig. 3.. LynBKO mice and female LynAKO mice develop severe splenomegaly.
Spleen masses from four to six different cohorts of male mice aged 8.5 ± 0.4 months and female mice aged 8.4 ± 0.2 months; error bars: 95% CIs. In this and other figures, in addition to the annotated comparisons (asterisks colored by genotype), there were no significant differences between LynABhemi and WT. Dotted lines reflect phenotypic scoring: no splenomegaly (spleen <155 mg), mild splenomegaly (155 to 225 mg), or severe splenomegaly (>225 mg), referenced in later figures.
Fig. 4.
Fig. 4.. Isoform- and sex-specific differences in splenic monocyte and DC composition of LynAKO and LynBKO mice.
Spleen cell suspensions from 8.5-month-old mice were stained for myeloid cell markers and analyzed by flow cytometry. Counting beads were used to calculate the total number of cells per spleen, from which the fractional content of each cell type was calculated. Populations: Classical monocyte (cMono: CD64+MerTKLy6Chi), intermediate monocyte (iMono: Ly6Cintermediate), patrolling monocyte (pMono: Ly6Clo), macrophage (Mac: CD64+MerTK+), conventional type 1 DC (cDC1: CD64CD11chiMHCIIhiCD11bloXCR1hi), conventional type 2 DC (cDC2: CD11bhiXCR1lo), CD11c+SiglecFMHCIIlo putative pre-DC [put.pre-DC (–60)], plasmacytoid DC (pDC: CD11cloLy6ChiPDCA1hi), eosinophil (Eos: Ly6GmedSiglec-F+SSChi), and neutrophil (Neut: Ly6Ghi). (A and B) Fractional content of splenic monocyte (A) and cDC2 (B) populations. Error bars: 95% CI. Asterisks are statistical comparisons colored by genotype; no significant differences between LynABhemi and WT populations. Data pooled from four to six separate cohort analyses. Gating is shown in fig. S7, and cell counts and statistics are shown in figs. S9 to S11. (C) Myeloid cell populations in Lyn knockout mice. Labels and dotted lines highlight total splenic cell populations (or fractional populations, where indicated) that were increased significantly relative to same-sex WT comparators. LynABhemi analyses are included in the supplement. (D) Summary of myeloid cell imbalances in Lyn knockout mice.
Fig. 5.
Fig. 5.. Differential polarization of myeloid cells and BAFF production from male and female LynAKO and LynBKO mice.
Spleen cell suspensions from 8.5-month-old male and female mice were stained for markers of myeloid polarization and analyzed by flow cytometry. Geometric mean fluorescence intensities (gMFIs) reported relative to the average WT value for each cell type and marker within each of four to six experiment days. Statistical annotations and error bars as described in Fig. 4. (A) Expression of proinflammatory polarization markers by MerTK+ macrophages. (B) Expression of neutrophil and DC activation/polarization markers. (C) Serum from 8.5-month-old male and female mice was assayed for BAFF using ELISA; error bars: SEM.
Fig. 6.
Fig. 6.. B cell development is rescued by expression of LynA or LynB.
Spleen cell suspensions from 8.5-month-old male and female mice were stained for markers of B cell development and analyzed by flow cytometry on four to six cohort/experiment days. (A) Total spleen B cell numbers; error bars: 95% CI. (B) Representative flow cytometry plots showing gates for follicular B cells (Fo: CD93CD23+), T1 B cells (CD93+CD23), T2/T3 B cells (CD93+CD23+), and marginal zone B cells (MZ: CD23CD21/35+). (C) Total numbers of B cell transitional populations T1 and IgMlo T3 per spleen. (D) Surface MHCII expression on T1 and T3 B cells relative to WT within each experiment. (E) Total numbers of Fo and MZ B cells per spleen. (F) Surface MHCII expression on Fo and MZ B cells.
Fig. 7.
Fig. 7.. Unique expansion of activated and autoimmunity-associated B cell subsets in LynAKO and LynBKO mice.
Spleen cell suspensions from 8.5-month-old male and female mice were stained for B cell markers and analyzed by flow cytometry. Populations of differentiated B cells: GL7+ GC and activated B cells (GL7+: B220+GL7hi), B1 B cells (B220+CD11bhi), ABCs (CD19hiCD21/35), plasma cells and plasmablasts (PBPC: CD138hiIgH+Lhi), and switched B cells (IgMIgD). (A) Total splenic numbers of GL7+ B cells. (B) Total splenic numbers of IgM+ (unswitched) plasma cells and plasmablasts. (C) Fractional content of each B cell subset within the total B cell population; the PBPC pool includes IgM+ and IgM cells. Labels and dotted lines highlight total splenic cell populations (or fractional populations, where indicated) that differ significantly from WT comparators. Gating is shown in fig. S13, and raw cell counts, statistics, and LynABhemi data are shown in Fig. 6 and figs. S14 and S16. No significant differences between LynABhemi and WT. Data pooled from four to six separate cohort analyses. (D) Summary of Lyn knockout splenic B cell composition.
Fig. 8.
Fig. 8.. LynAKO and LynBKO mice with splenomegaly or low body mass develop autoimmune disease.
Mice (8.5 months old) were tested for indicators of autoimmunity and lupus nephritis. (A to D) Kidney and spleen sections and epifluorescence images were obtained from female and male mice with varying degrees of splenomegaly and body mass. (A) Representative hematoxylin and eosin (H&E)–stained kidney sections were deidentified and scored for glomerulonephritis; scale bar, 200 μm. Boxed regions are enlarged in the bottom row. Occurrence of splenomegaly or low body mass in the same individual (+ yes, − no), referenced after unblinding as defined in Fig. 3. Other indicators of disease are similar in all image panels. (B) Frequency of no (−), mild, or severe (Sev.) glomerulonephritis in clinical scoring; numbers reflect scores from sections prepared from individual mice; corresponding frequencies of splenomegaly and low body mass are indicated. Analysis pool: WT 5 M + 2 F, LynAKO 4 M + 3 F, LynBKO 2 M + 5 F, LynKO 5 M + 1 F, LynABhemi 1 M + 5 F. (C) Immunofluorescence microscopy images showing nuclei (DAPI), IgG deposition (Texas Red), and C3 deposition (FITC), n = 3; scale bar, 100 μm. Analysis pool for (C) to (F): WT 1 M + 2 F, LynAKO 3 F, LynBKO 3 F, LynKO 3 M, and LynABhemi 1 M + 2 F. (D) Quantification of IgG and C3 staining, using Imaris software; error bars, SEM. Corresponding frequencies of splenomegaly or low body mass are indicated; the same individuals were used for all other quantifications in this figure. (E) Masson’s trichrome (collagen, fibrin, and erythrocyte) staining of kidney; scale bar, 500 μm. (F) Quantification of trichrome staining in kidney and spleen. NIH ImageJ software was used to deconvolute and perform region-of-interest analysis; error bars, SEM.
Fig. 9.
Fig. 9.. LynAKO and LynBKO mice with splenomegaly or low body mass produce ANA and have elevated levels of serum IgM.
Serum was collected from 8.5-month-old male and female mice and assayed for antibody production. (A) Serum ANA detection via FITC staining of Hep-2 cells. Occurrence of splenomegaly or low body mass in the same individual is indicated (+ yes, − no). (B) Frequency of ANA negativity (−) and positivity (+). Occurrence of splenomegaly or low body mass in the same individual (+ yes, − no) as defined in Fig. 3. Significance for raw contingency data was assessed via two-sided Fisher’s exact test with Bonferroni correction for multiple comparisons. Analysis pool: WT 4 M + 8 F, LynAKO 6 M + 6 F, LynBKO 4 M + 8 F, and LynKO 6 M + 6 F. (C) ELISA-derived IgM levels and associated splenomegaly or low body mass; error bars, SEM.
Fig. 10.
Fig. 10.. Splenomegaly in male LynAKO and LynBKO mice corresponds with disruptions in spleen architecture.
(A) Spleen sections from 8.5-month-old male WT and Lyn knockout mice were imaged via immunofluorescence microscopy. Co-occurrence of either splenomegaly or low body mass (defined in Fig. 3) is indicated (+/−). Nuclei (DAPI), B220+ B cells (FITC), GL7+ GC or activated B cells [Alexa Fluor (AF) 555], CD11b+ myeloid cells (AF594), and TCRβ+ T cells (AF647) are shown; scale bar, 500 μm. (B) Fourfold increased magnification showing the architecture of a representative B cell follicle, GC, and T cell zone; scale bar, 100 μm. (C) Spleen sections visualized by H&E staining; scale bar, 500 μm. Images are representative of n = 3 mice.

References

    1. Yamanashi Y., Fukui Y., Wongsasant B., Kinoshita Y., Ichimori Y., Toyoshima K., Yamamoto T., Activation of Src-like protein-tyrosine kinase Lyn and its association with phosphatidylinositol 3-kinase upon B-cell antigen receptor-mediated signaling. Proc. Natl. Acad. Sci. U.S.A. 89, 1118–1122 (1992). - PMC - PubMed
    1. Smith K. G., Tarlinton D. M., Doody G. M., Hibbs M. L., Fearon D. T., Inhibition of the B cell by CD22: A requirement for Lyn. J. Exp. Med. 187, 807–811 (1998). - PMC - PubMed
    1. Brodie E. J., Infantino S., Low M. S. Y., Tarlinton D. M., Lyn, lupus, and (B) lymphocytes, a lesson on the critical balance of kinase signaling in immunity. Front. Immunol. 9, 401 (2018). - PMC - PubMed
    1. Scapini P., Pereira S., Zhang H., Lowell C. A., Multiple roles of Lyn kinase in myeloid cell signaling and function. Immunol. Rev. 228, 23–40 (2009). - PMC - PubMed
    1. Brian B. F., Freedman T. S., The Src-family kinase lyn in immunoreceptor signaling. Endocrinology 162, bqab152 (2021). - PMC - PubMed