

Estimating COVID-19 Hospitalizations in the United States With Surveillance Data Using a Bayesian Hierarchical Model: Modeling Study
- PMID: 35452402
- PMCID: PMC9169704
- DOI: 10.2196/34296
Estimating COVID-19 Hospitalizations in the United States With Surveillance Data Using a Bayesian Hierarchical Model: Modeling Study
Abstract
Background: In the United States, COVID-19 is a nationally notifiable disease, meaning cases and hospitalizations are reported by states to the Centers for Disease Control and Prevention (CDC). Identifying and reporting every case from every facility in the United States may not be feasible in the long term. Creating sustainable methods for estimating the burden of COVID-19 from established sentinel surveillance systems is becoming more important.
Objective: We aimed to provide a method leveraging surveillance data to create a long-term solution to estimate monthly rates of hospitalizations for COVID-19.
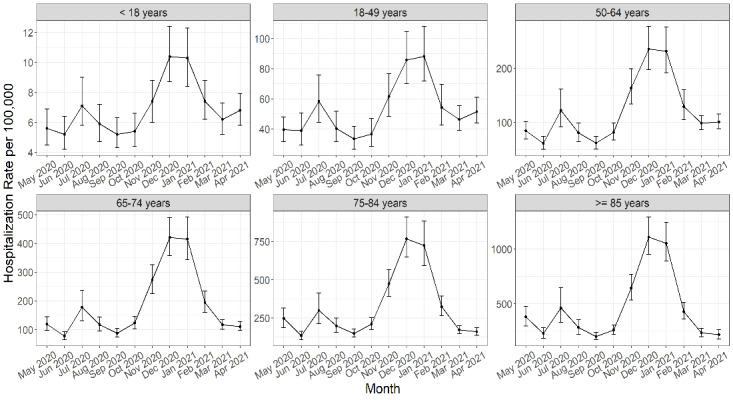
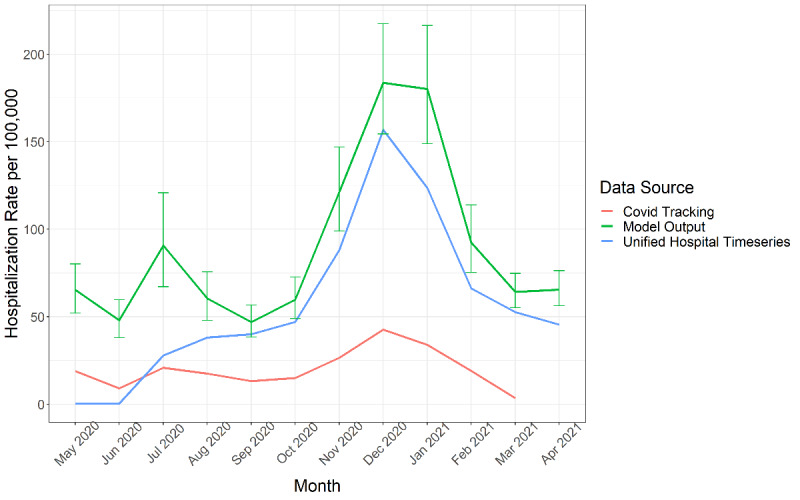
Methods: We estimated monthly hospitalization rates for COVID-19 from May 2020 through April 2021 for the 50 states using surveillance data from the COVID-19-Associated Hospitalization Surveillance Network (COVID-NET) and a Bayesian hierarchical model for extrapolation. Hospitalization rates were calculated from patients hospitalized with a lab-confirmed SARS-CoV-2 test during or within 14 days before admission. We created a model for 6 age groups (0-17, 18-49, 50-64, 65-74, 75-84, and ≥85 years) separately. We identified covariates from multiple data sources that varied by age, state, and month and performed covariate selection for each age group based on 2 methods, Least Absolute Shrinkage and Selection Operator (LASSO) and spike and slab selection methods. We validated our method by checking the sensitivity of model estimates to covariate selection and model extrapolation as well as comparing our results to external data.
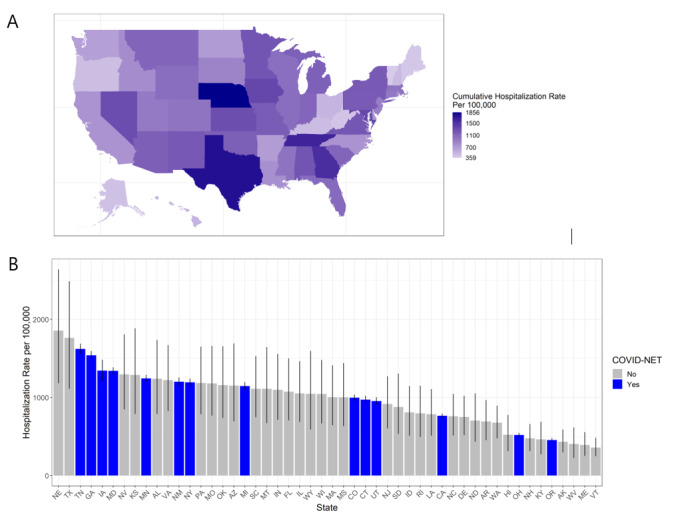
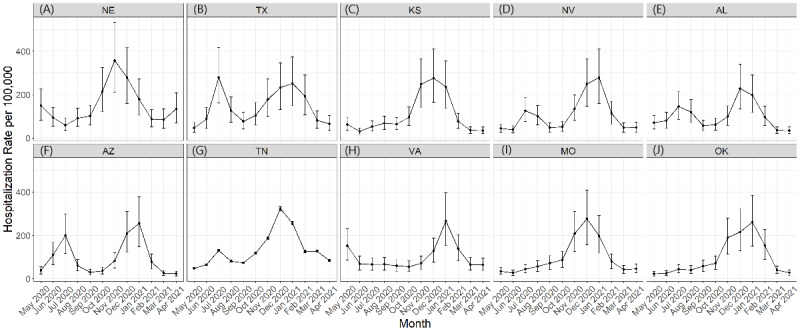
Results: We estimated 3,583,100 (90% credible interval [CrI] 3,250,500-3,945,400) hospitalizations for a cumulative incidence of 1093.9 (992.4-1204.6) hospitalizations per 100,000 population with COVID-19 in the United States from May 2020 through April 2021. Cumulative incidence varied from 359 to 1856 per 100,000 between states. The age group with the highest cumulative incidence was those aged ≥85 years (5575.6; 90% CrI 5066.4-6133.7). The monthly hospitalization rate was highest in December (183.7; 90% CrI 154.3-217.4). Our monthly estimates by state showed variations in magnitudes of peak rates, number of peaks, and timing of peaks between states.
Conclusions: Our novel approach to estimate hospitalizations for COVID-19 has potential to provide sustainable estimates for monitoring COVID-19 burden as well as a flexible framework leveraging surveillance data.
Keywords: Bayesian; COVID-19; COVID-NET; SARS-CoV-2; United States; data; estimation; extrapolation; framework; hierarchical; hospital; hospitalization; model; modeling; monitoring; novel; prediction; rate; surveillance.
©Alexia Couture, A Danielle Iuliano, Howard H Chang, Neha N Patel, Matthew Gilmer, Molly Steele, Fiona P Havers, Michael Whitaker, Carrie Reed. Originally published in JMIR Public Health and Surveillance (https://publichealth.jmir.org), 02.06.2022.
Conflict of interest statement
Conflicts of Interest: None declared.
Figures
References
-
- Coronavirus Disease 2019 (COVID-19) 2020 Interim Case Definition, Approved August 5, 2020. Centers for Disease Control and Prevention. [2021-08-08]. https://ndc.services.cdc.gov/case-definitions/coronavirus-disease-2019-2...
-
- Coronavirus Disease 2019 (COVID-19) 2020 Interim Case Definition, Approved April 5, 2020. Centers for Disease Control and Prevention. [2021-08-08]. https://ndc.services.cdc.gov/case-definitions/coronavirus-disease-2019-2...
-
- COVID-19 Death Data and Resources. Centers for Disease Control and Prevention. 2021. Feb 05, [2021-08-08]. https://www.cdc.gov/nchs/nvss/covid-19.htm .
-
- Hospital Reporting. HHS Protect Public Data Hub. [2021-08-08]. https://protect-public.hhs.gov/pages/hospital-reporting .
-
- Reese H, Iuliano AD, Patel NN, Garg S, Kim L, Silk BJ, Hall AJ, Fry A, Reed C. Estimated Incidence of Coronavirus Disease 2019 (COVID-19) Illness and Hospitalization-United States, February-September 2020. Clin Infect Dis. 2021 Jun 15;72(12):e1010–e1017. doi: 10.1093/cid/ciaa1780. http://europepmc.org/abstract/MED/33237993 6000389 - DOI - PMC - PubMed
Publication types
MeSH terms
LinkOut - more resources
Full Text Sources
Medical
Miscellaneous
