

Aperiodic electrophysiological activity in preterm infants is linked to subsequent autism risk
- PMID: 35452546
- PMCID: PMC9169229
- DOI: 10.1002/dev.22271
Aperiodic electrophysiological activity in preterm infants is linked to subsequent autism risk
Abstract
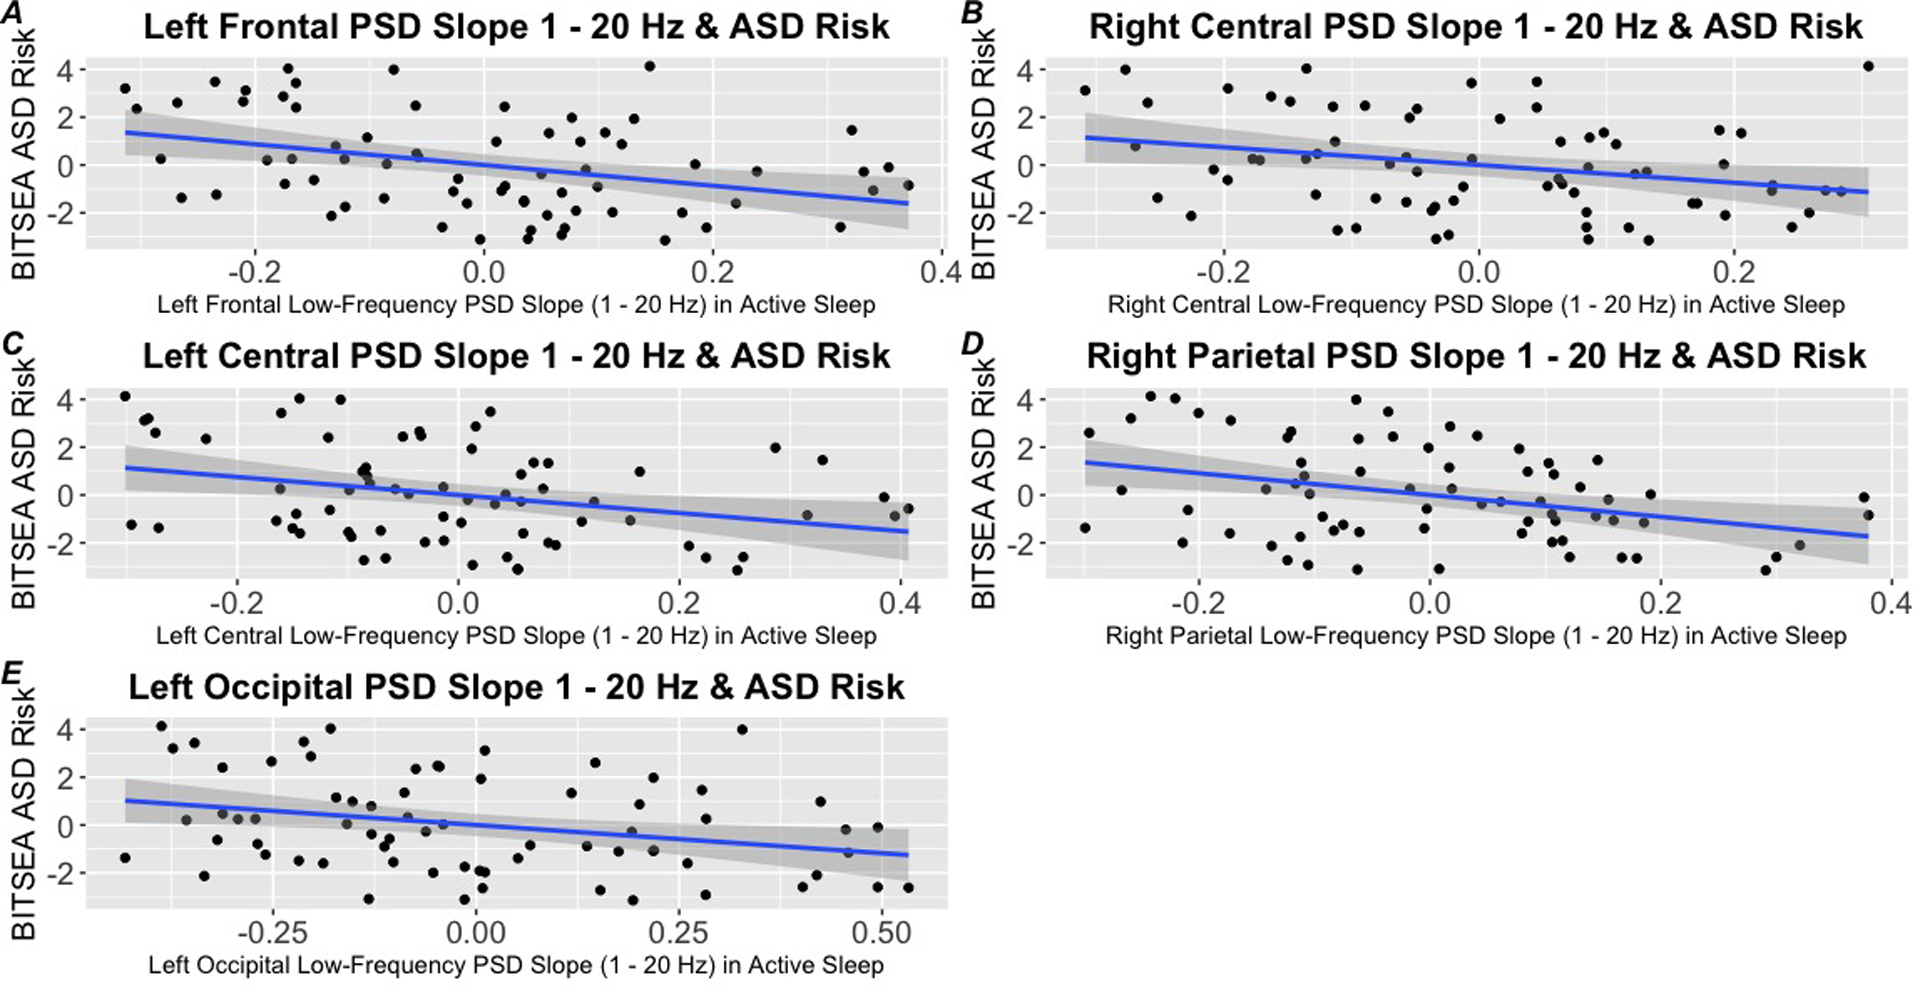
Approximately 7% of preterm infants receive an autism spectrum disorder (ASD) diagnosis. Yet, there is a significant gap in the literature in identifying prospective markers of neurodevelopmental risk in preterm infants. The present study examined two electroencephalography (EEG) parameters during infancy, absolute EEG power and aperiodic activity of the power spectral density (PSD) slope, in association with subsequent autism risk and cognitive ability in a diverse cohort of children born preterm in South Africa. Participants were 71 preterm infants born between 25 and 36 weeks gestation (34.60 ± 2.34 weeks). EEG was collected during sleep between 39 and 41 weeks postmenstrual age adjusted (40.00 ± 0.42 weeks). The Bayley Scales of Infant Development and Brief Infant Toddler Social Emotional Assessment (BITSEA) were administered at approximately 3 years of age adjusted (34 ± 2.7 months). Aperiodic activity, but not the rhythmic oscillatory activity, at multiple electrode sites was associated with subsequent increased autism risk on the BITSEA at three years of age. No associations were found between the PSD slope or absolute EEG power and cognitive development. Our findings highlight the need to examine potential markers of subsequent autism risk in high-risk populations other than infants at familial risk.
Keywords: aperiodic EEG; autism risk; electroencephalography (EEG); infants; neuronal oscillations; preterm birth.
© 2022 Wiley Periodicals LLC.
Conflict of interest statement
Figures
References
-
- Baio J, Wiggins L, Christensen DL, Maenner MJ, Daniels J, Warren Z, … Dowling NF (2018). Prevalence of Autism Spectrum Disorder Among Children Aged 8 Years - Autism and Developmental Disabilities Monitoring Network, 11 Sites, United States, 2014. MMWR Surveill Summ, 67(6), 1–23. doi: 10.15585/mmwr.ss6706a1 - DOI - PMC - PubMed
-
- Ballot DE, Ramdin T, Rakotsoane D, Agaba F, Davies VA, Chirwa T, & Cooper PA (2017). Use of the Bayley Scales of Infant and Toddler Development, Third Edition, to Assess Developmental Outcome in Infants and Young Children in an Urban Setting in South Africa. Int Sch Res Notices, 2017, 1631760. doi: 10.1155/2017/1631760 - DOI - PMC - PubMed
-
- Bayley N (2006). Bayley scales of infant and toddler development: Bayley-III (Vol. 7). San Antonio, Texas, USA: Harcourt Assessment, Psych. Corporation.
Publication types
MeSH terms
Grants and funding
LinkOut - more resources
Full Text Sources
Medical
Miscellaneous
