. 2022 May 3;34(5):731-746.e9.
doi: 10.1016/j.cmet.2022.03.013. Epub 2022 Apr 21.

The mitochondrial pyruvate carrier regulates memory T cell differentiation and antitumor function

Affiliations

The mitochondrial pyruvate carrier regulates memory T cell differentiation and antitumor function

Mathias Wenes et al. Cell Metab. .

Abstract

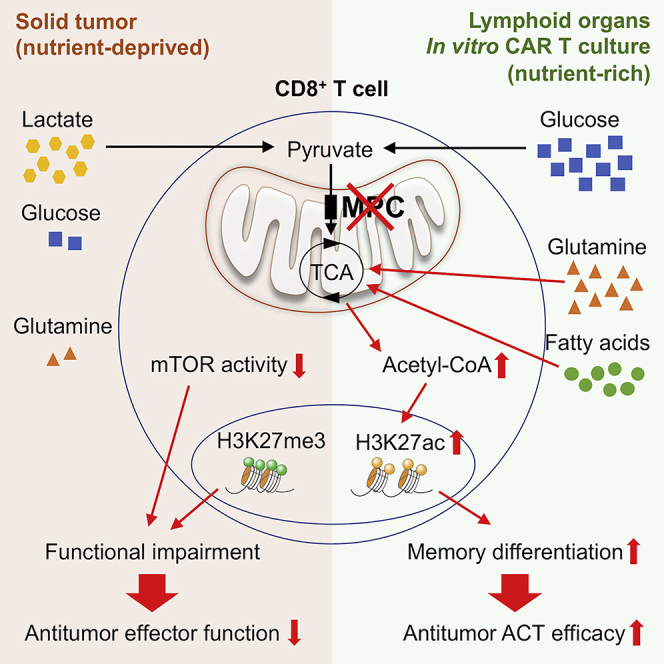
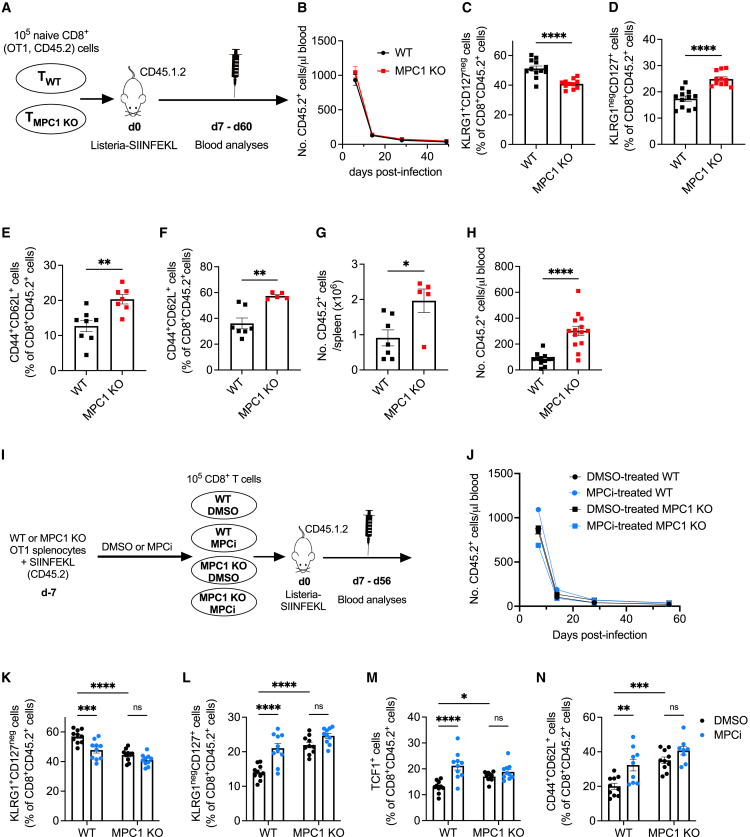
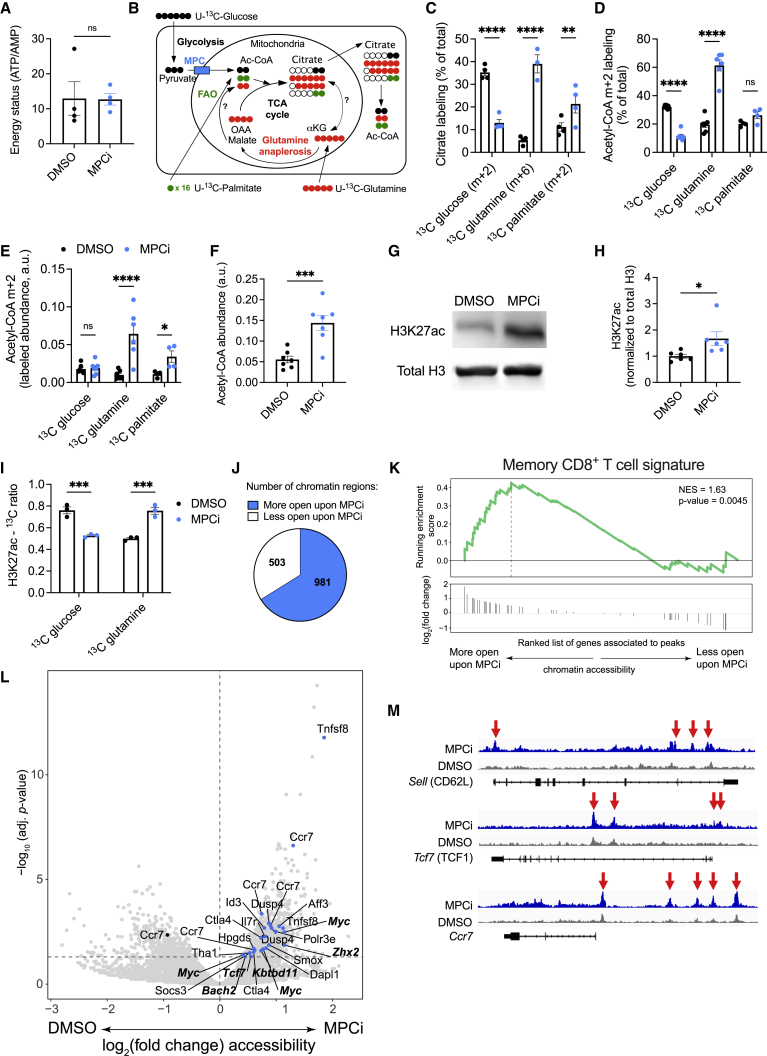
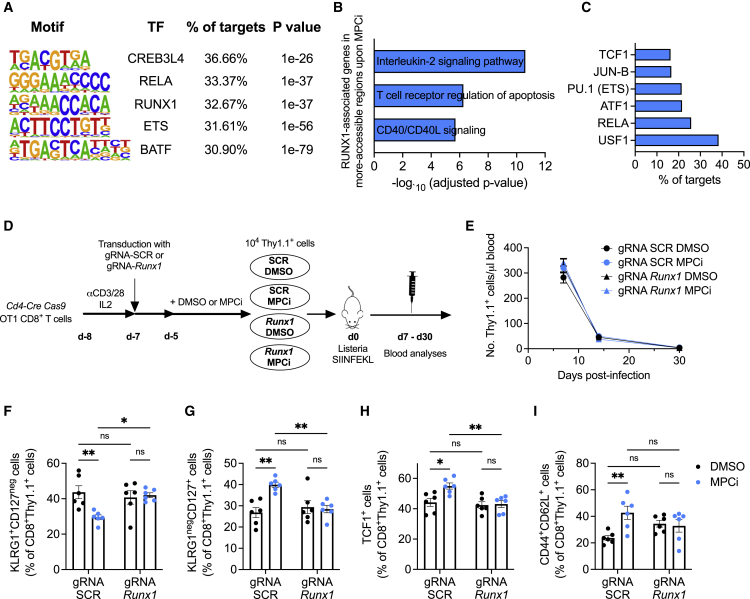
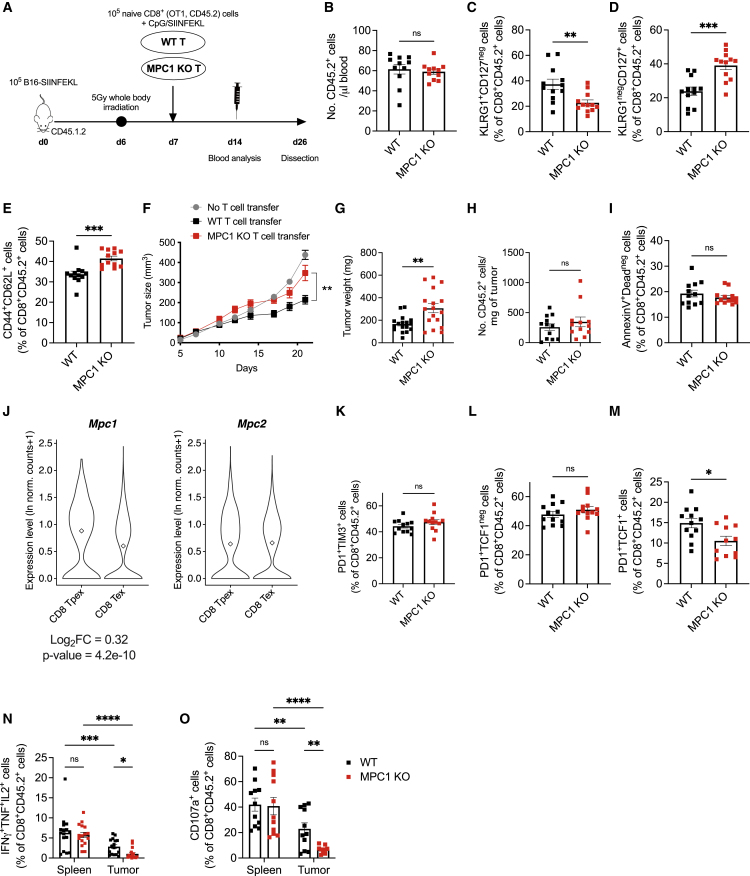
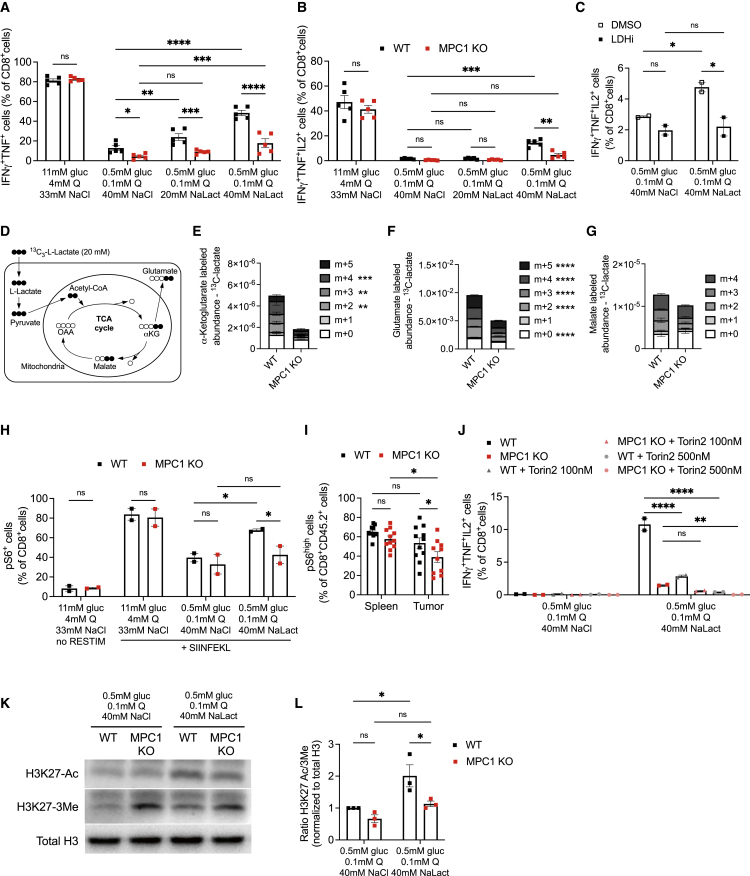
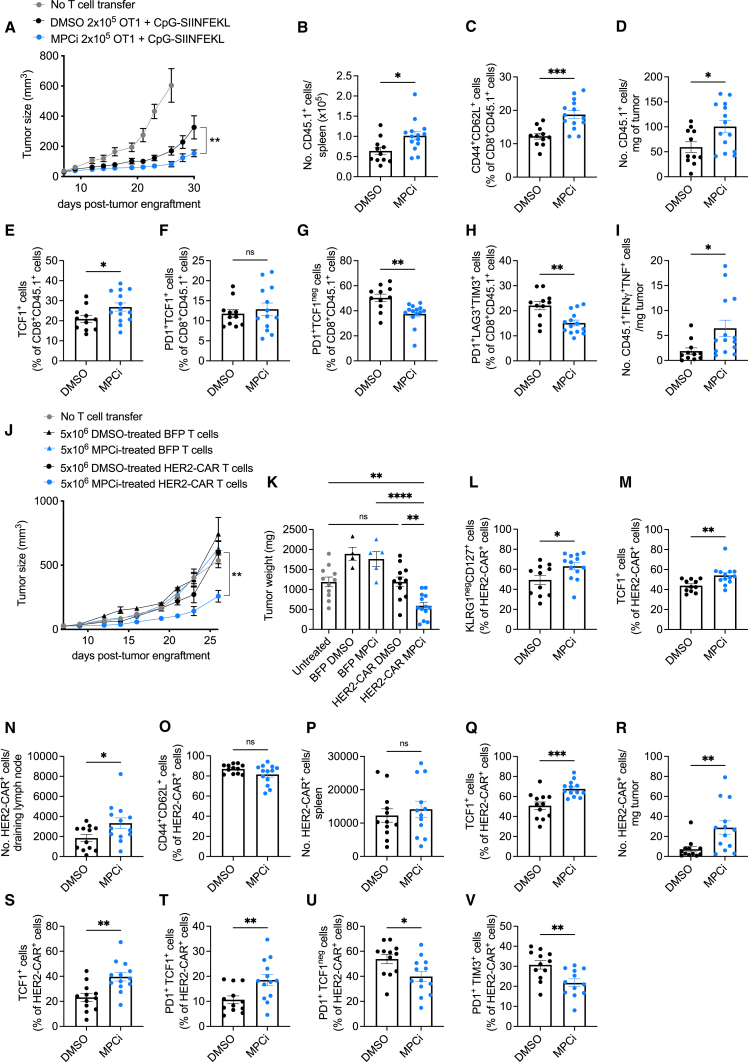
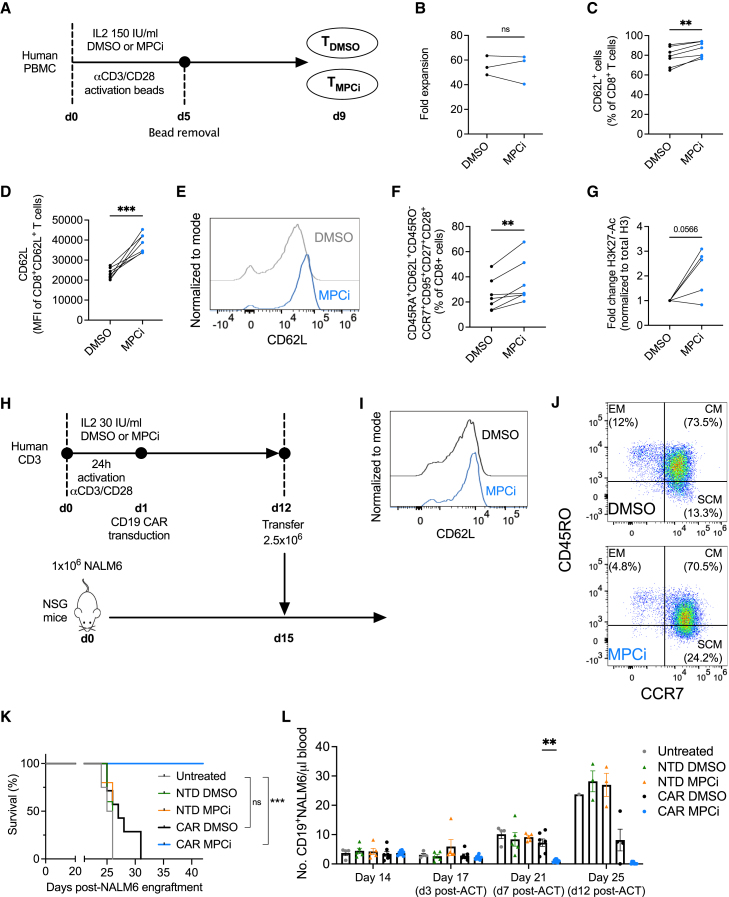
Glycolysis, including both lactate fermentation and pyruvate oxidation, orchestrates CD8+ T cell differentiation. However, how mitochondrial pyruvate metabolism and uptake controlled by the mitochondrial pyruvate carrier (MPC) impact T cell function and fate remains elusive. We found that genetic deletion of MPC drives CD8+ T cell differentiation toward a memory phenotype. Metabolic flexibility induced by MPC inhibition facilitated acetyl-coenzyme-A production by glutamine and fatty acid oxidation that results in enhanced histone acetylation and chromatin accessibility on pro-memory genes. However, in the tumor microenvironment, MPC is essential for sustaining lactate oxidation to support CD8+ T cell antitumor function. We further revealed that chimeric antigen receptor (CAR) T cell manufacturing with an MPC inhibitor imprinted a memory phenotype and demonstrated that infusing MPC inhibitor-conditioned CAR T cells resulted in superior and long-lasting antitumor activity. Altogether, we uncover that mitochondrial pyruvate uptake instructs metabolic flexibility for guiding T cell differentiation and antitumor responses.

Keywords: T cell memory; chimeric antigen receptor T cell therapy; immunometabolism; mitochondrial pyruvate carrier; tumor-infiltrating lymphocyte metabolism.


Conflict of interest statement

Declaration of interests M.W. and P.R. are inventors on a patent application related to these findings and have research collaborations with MPC Therapeutics, with P.R. being a member of the advisory board. D.M. is an inventor on patents related to CAR T cell therapy, filed by the University of Pennsylvania and the University of Geneva, and is a consultant for Limula Therapeutics and MPC Therapeutics. P.-C.H. is scientific advisory for Elixiron Immunotherapeutics, Acepodia, and Novartis. P.-C.H. also receives research support from Elixiron Immunotherapeutics. S.Y.L. is a consultant to Senda Biosciences.

Figures

None
Graphical abstract
Figure 1
Figure 1
Inhibiting mitochondrial pyruvate import during CD8+ T cell activation favors memory differentiation (A) Listeria experiment. (B) Number of transferred cells in the blood. (C–E) Percentage of SLECs (C) and MPECs (D) at 1 week and TCM cells (E) at 4 weeks post-infection, out of transferred cells in the blood. n = 11–12 mice/group in (B)–(D) or 7–8 mice/group in (E); pooled data from 2 independent experiments. (F and G) Percentage of TCM cells (F) and number of transferred cells (G) in the spleen 60 days post-infection (F) (n = 7 mice [WT] versus 5 mice [MPC1 KO]; pooled data from 2 independent experiments). (H) At 60 days post-infection, transferred cells were FACS-sorted from spleens and retransferred in new host, followed by Listeria infection. Expansion of the retransferred cells was measured in the blood at day 6 post-infection (n = 12–14 mice/group; pooled data from 2 independent experiments). (I) Experimental scheme (MPCi = 20 μM UK5099). (J) Number of transferred cells in the blood. (K–N) Percentage of SLECs (K), MPECs (L), and TCF1-positive cells (M) at 1 week and TCM cells (N) at 8 weeks post-infection, out of transferred cells in the blood (n = 10 mice/group; pooled data from 2 different experiments). Data are represented as mean ± SEM. Statistics are based on unpaired, two-tailed Student’s t test (C–H) or two-way ANOVA (K–N), p < 0.05, ∗∗p < 0.01, ∗∗∗p < 0.001, ∗∗∗∗p < 0.0001, and ns (p > 0.05).
Figure 2
Figure 2
MPC inhibition in CD8+ T cells induces alternative metabolic fluxes that results in an epigenetic crosstalk and memory imprinting (A) Energy status (ATP/AMP), 72 h post-activation, based on mass spectrometry data (n = 4 biological replicates). (B) Schematic representation of metabolite labeling patterns (OAA, oxaloacetate; αKG, α-ketoglutarate). (C and D) Percentage of the indicated citrate isotope out of total citrate (C) or of m+2 acetyl-CoA out of total acetyl-CoA (D) using different heavy labeled substrates. (E) Abundance of m+2 acetyl-CoA, derived from different heavy labeled substrates. (F) Abundance of total cellular acetyl-CoA. n = 4 biological replicates in (C) and n = 7 biological replicates in (D)–(F); pooled from 2 independent experiments. (G and H) Representative western blot (G) and quantification shown as fold change compared with DMSO (H) (n = 6 biological replicates; pooled from 4 independent experiments). (I) Incorporation of carbons derived from glucose or glutamine into the acetyl group on H3K27. Shown here is the ratio of the intensity of the 3rd isotopic peak (containing 2∗13C) over the monoisotopic peak (only 12C) of acetylated peptide KSAPATGGVKKPHR (see also Figures S2H and S2I) (n = 3 biological replicates). (J) Number of chromatin regions associated with more open or closed regions upon MPCi treatment (n = 3 [DMSO] or 2 [UK5099] biological replicates). (K) Gene set enrichment analysis of an MPEC signature (Dominguez et al., 2015). (L) Volcano plot showing the genes associated to more closed (left) or more open (right) chromatin regions upon MPCi treatment. Genes associated with the MPEC signature in (K) are highlighted in blue, with genes previously associated to H3K27ac in bold (Gray et al., 2017). (M) Representative ATAC-seq traces in and around the gene loci of Sell, Tcf7, and Ccr7. Red arrows highlight increased chromatin accessibility. Data are represented as mean ± SEM. Statistics are based on unpaired, two-tailed Student’s t test (A, F, and H) or two-way ANOVA (C–E and I), p < 0.05, ∗∗p < 0.01, ∗∗∗p < 0.001, ∗∗∗∗p < 0.0001, and ns (p > 0.05). See also Figures S1 and S2.
Figure 3
Figure 3
RUNX1 orchestrates CD8+ T cell memory differentiation upon MPC inhibition (A) Transcription factor motifs in the more accessible regions of T cells treated with MPCi based on the ATAC sequencing data described in Figure 2. (B) Top three significant Bioplanet 2019 pathways identified by Enrichr software on more accessible genes upon MPCi treatment that contain a RUNX1 transcription factor motif. (C) Transcription factor motifs in the RUNX1-associated more accessible regions (targets) upon MPCi treatment. (D) Experimental scheme. (E) Number of transferred Thy1.1-positive CD8+ T cells in the blood. (F–I) Percentage of SLECs (F), MPECs (G), and TCF1-positive cells (H) at 2 weeks and TCM cells (I) at 4 weeks post-infection in the blood (n = 6–7 mice/group; pooled data from 2 different experiments). Data are represented as mean ± SEM. Statistics are based on two-way ANOVA, p < 0.05, ∗∗p < 0.01, and ns (p > 0.05). See also Figure S3.
Figure 4
Figure 4
MPC deletion in CD8+ T cells blunts their antitumor potential (A) Experimental scheme. (B–D) Number of transferred cells in the blood at 10 days post-transfer (B) and their percentage of SLECs (C) and MPECs (D) (n = 11–12 mice/group; pooled data from 2 independent experiments). (E) Percentage of TCM cells among transferred cells in the spleen (n = 12 mice/group; pooled data from 2 independent experiments). (F and G) Tumor growth (F) and weight (G) (n = 13–17 mice/group; pooled data from 3 independent experiments). (H) T cell infiltration in tumors (n = 12 mice/group; pooled data from 2 independent experiments). (I) Apoptotic tumor-infiltrating T cells (n = 12–13 mice/group; pooled data from 2 independent experiments). (J) Expression level of Mpc1 and Mpc2 in cell clusters identified as progenitor exhausted (Tpex) and terminally exhausted (Tex) CD8+ T cells based on single-cell RNA-seq data (source: https://spica.unil.ch/), reported as normalized gene expression (ln norm. counts +1). (K) Tumor-infiltrating T cells co-expressing PD1 and TIM3. (L and M) Percentage of Tex (L) and Tpex (M) cells among the tumor-infiltrating transferred T cells (n = 11–12 mice/group; pooled data from 2 independent experiments). (N and O) Percentage of splenic or tumor T cells expressing IFNγ, TNF, and IL-2 (N) or CD107a (O) (n = 16 mice/group; pooled data from 3 independent experiments, as shown in N, and n = 11 mice/group; pooled data from 2 independent experiments, as shown in O). Data are represented as mean ± SEM. Statistics are based on unpaired, two-tailed Student’s t test (B–I and K–M), Wilcoxon test (J), or two-way ANOVA (N and O), p < 0.05, ∗∗p < 0.01, ∗∗∗p < 0.001, ∗∗∗∗p < 0.0001, and ns (p > 0.05). See also Figure S4.
Figure 5
Figure 5
Tumor-infiltrating CD8+ T cells oxidize lactate in their mitochondria to maintain effector function (A and B) Cytokine expression (n = 5 biological replicates/genotype; pooled data from 2 independent experiments). (C) Cytokine expression in the presence of 25 μM LDHA/B inhibitor GSK 2837808A (LDHi) or DMSO control (n = 2 biological replicates/group; pooled data from 2 independent experiments). (D) Schematic representation of the metabolic pathways allowing for the detection of carbon incorporation in TCA metabolites derived from uniformly labeled 13C-L-lactate. (E–G) Relative abundance of α-ketoglutarate, glutamate, and malate in T cells cultured for 18 h in nutrient-deprived medium containing 20 mM of uniformly labeled 13C-L-lactate (“metabolite + n” equals the molecular mass plus the number of incorporated heavy carbons) (n = 3 biological replicates). (H) Percentage of T cells positive for phosphorylated S6 (serine 235–236) protein (n = 2 biological replicates from 2 independent experiments). (I) Percentage of phosphorylated S6-positive spleen or B16-SIINFEKL tumor-infiltrating T cells (n = 11 mice/group; pooled data from 2 independent experiments). (J) Cytokine production in the presence of the mTOR inhibitor Torin2 (n = 2 biological replicates/genotype; pooled data from 2 independent experiments). (K and L) Representative western blot (K) and quantification of the ratio of acetylation over methylation shown as fold change compared with WT T cells starved in 0.5 mM glucose, 0.1 mM glutamine, and 40 mM NaCl (L) (n = 3 biological replicates/genotype; pooled from 3 independent experiments). Data are represented as mean ± SEM. Statistics are based on two-way ANOVA, p < 0.05, ∗∗p < 0.01, ∗∗∗p < 0.001, ∗∗∗∗p < 0.0001, and ns (p > 0.05). See also Figure S5.
Figure 6
Figure 6
MPC inhibition during CAR T cell in vitro activation and expansion induces superior antitumor activity upon ACT in a mouse melanoma model (A) Tumor growth following ACT of DMSO or UK5099 (MPCi)-conditioned OT1 T cells. (B and C) Number of transferred cells (B) and their percentage of TCM (C) in the spleen. (D–H) Number of tumor-infiltrating transferred cells per milligram of tumor (D) and their percentage of TCF1-positive cells (E), Tpex (F), Tex (G), and cells co-expressing PD1, LAG3, and TIM3 (H). (I) Number of tumor-infiltrating transferred cells co-expressing IFNγ and TNF. In (A)–(I), n = 11 mice (DMSO) and 14 mice (MPCi); pooled data from 2 independent experiments. (J and K) Tumor growth (J) and weight (K) of B16-HER2 tumors following treatment with DMSO or MPCi-conditioned HER2-CAR or BFP control T cells. (L and M) Percentage of TCM cells (L) and TCF1-expressing cells (M) out of HER2-CAR-positive cells in the blood 12 days after ACT. (N and O) Number of HER2-CAR-positive cells (N) and their percentage of TCM (O) in the tumor-draining lymph node. (P and Q) Number of HER2-CAR-positive cells (P) and their percentage of TCF1-positive cells (Q) in the spleen. (R–V) Number of tumor-infiltrating HER2-CAR-positive cells per milligram of tumor (R) and their percentage of TCF1-positive cells (S), Tpex (T), Tex (U), and cells co-expressing PD1 and TIM3 (V). In (J)–(V), n = 11 mice (untreated), 4–5 mice (DMSO- and MPCi-BFP-T ACT), 12–13 mice (DMSO- and MPCi-HER2-CAR T ACT). BFP data are derived from 1 experiment; untreated and HER2-CAR T cell transfer is pooled data from 2 independent experiments. Data are represented as mean ± SEM. Statistics are based on unpaired, two-tailed Student’s t test (A–I and L–V) or one-way ANOVA (J and K), p < 0.05, ∗∗p < 0.01, ∗∗∗p < 0.001, ∗∗∗∗p < 0.0001, and ns (p > 0.05). See also Figure S6.
Figure 7
Figure 7
MPC inhibition dramatically improves human CD19-CAR T cell therapy in a xenograft leukemia model (A) Experimental scheme. (B) Fold expansion after 9 days of culture (n = 3 human donors/group). (C–E) Percentage CD62L-positive CD8+ T cells (C) and median fluorescent intensity (MFI) of CD62L in the CD62L-positive population (D), and representative histogram from one donor (E). (F) Percentage of stem cell-like memory CD8+ T cells, measured by flow cytometry. In (C)–(F), n = 7 human donors/group; pooled data from 2 independent experiments. (G) Western blot quantification of H3K27 acetylation shown as fold change compared with DMSO (n = 5 human donors/group; pooled data from 2 independent experiments). (H) Experimental scheme. (I and J) Histogram of CD62L expression (I) and FACS plot showing CD45-RO and CCR7 expression (J) in CD8+ T cells from a representative donor, 7 days after transduction (EM, effector memory; CM, central memory; SCM, stem cell-like memory). (K) Overall survival. (L) Number of NALM6 cells in the blood (n = 4 mice for untreated, n = 5 mice for NTD DMSO and NTD MPCi, n = 7 mice for CAR DMSO, and n = 8 mice for CAR MPCi; pooled data from 2 independent experiments). Data are represented as mean ± SEM. Statistics are based on paired, two-tailed Student’s t test (B–D and F–G), log rank test (K), or two-way ANOVA using Fisher’s LSD test (L), p < 0.05, ∗∗p < 0.01, ∗∗∗p < 0.001, or as indicated. See also Figure S7.

Comment in

References

    1. Aikawa Y., Nguyen L.A., Isono K., Takakura N., Tagata Y., Schmitz M.L., Koseki H., Kitabayashi I. Roles of HIPK1 and HIPK2 in AML1- and p300-dependent transcription, hematopoiesis and blood vessel formation. EMBO J. 2006;25:3955–3965. - PMC - PubMed
    1. Andreatta M., Corria-Osorio J., Müller S., Cubas R., Coukos G., Carmona S.J. Interpretation of T cell states from single-cell transcriptomics data using reference atlases. Nat. Commun. 2021;12:2965. - PMC - PubMed
    1. Bian Y., Li W., Kremer D.M., Sajjakulnukit P., Li S., Crespo J., Nwosu Z.C., Zhang L., Czerwonka A., Pawłowska A., et al. Cancer SLC43A2 alters T cell methionine metabolism and histone methylation. Nature. 2020;585:277–282. - PMC - PubMed
    1. Blank C.U., Haining W.N., Held W., Hogan P.G., Kallies A., Lugli E., Lynn R.C., Philip M., Rao A., Restifo N.P., et al. Defining 'T cell exhaustion'. Nat. Rev. Immunol. 2019;19:665–674. - PMC - PubMed
    1. Bourgeois C., Rocha B., Tanchot C. A role for CD40 expression on CD8+ T cells in the generation of CD8+ T cell memory. Science. 2002;297:2060–2063. - PubMed

Publication types

MeSH terms