. 2022 May 9;40(5):494-508.e5.
doi: 10.1016/j.ccell.2022.04.001. Epub 2022 Apr 21.

Non-cleavable hinge enhances avidity and expansion of CAR-T cells for acute myeloid leukemia

Affiliations

Non-cleavable hinge enhances avidity and expansion of CAR-T cells for acute myeloid leukemia

Mark B Leick et al. Cancer Cell. .

Abstract

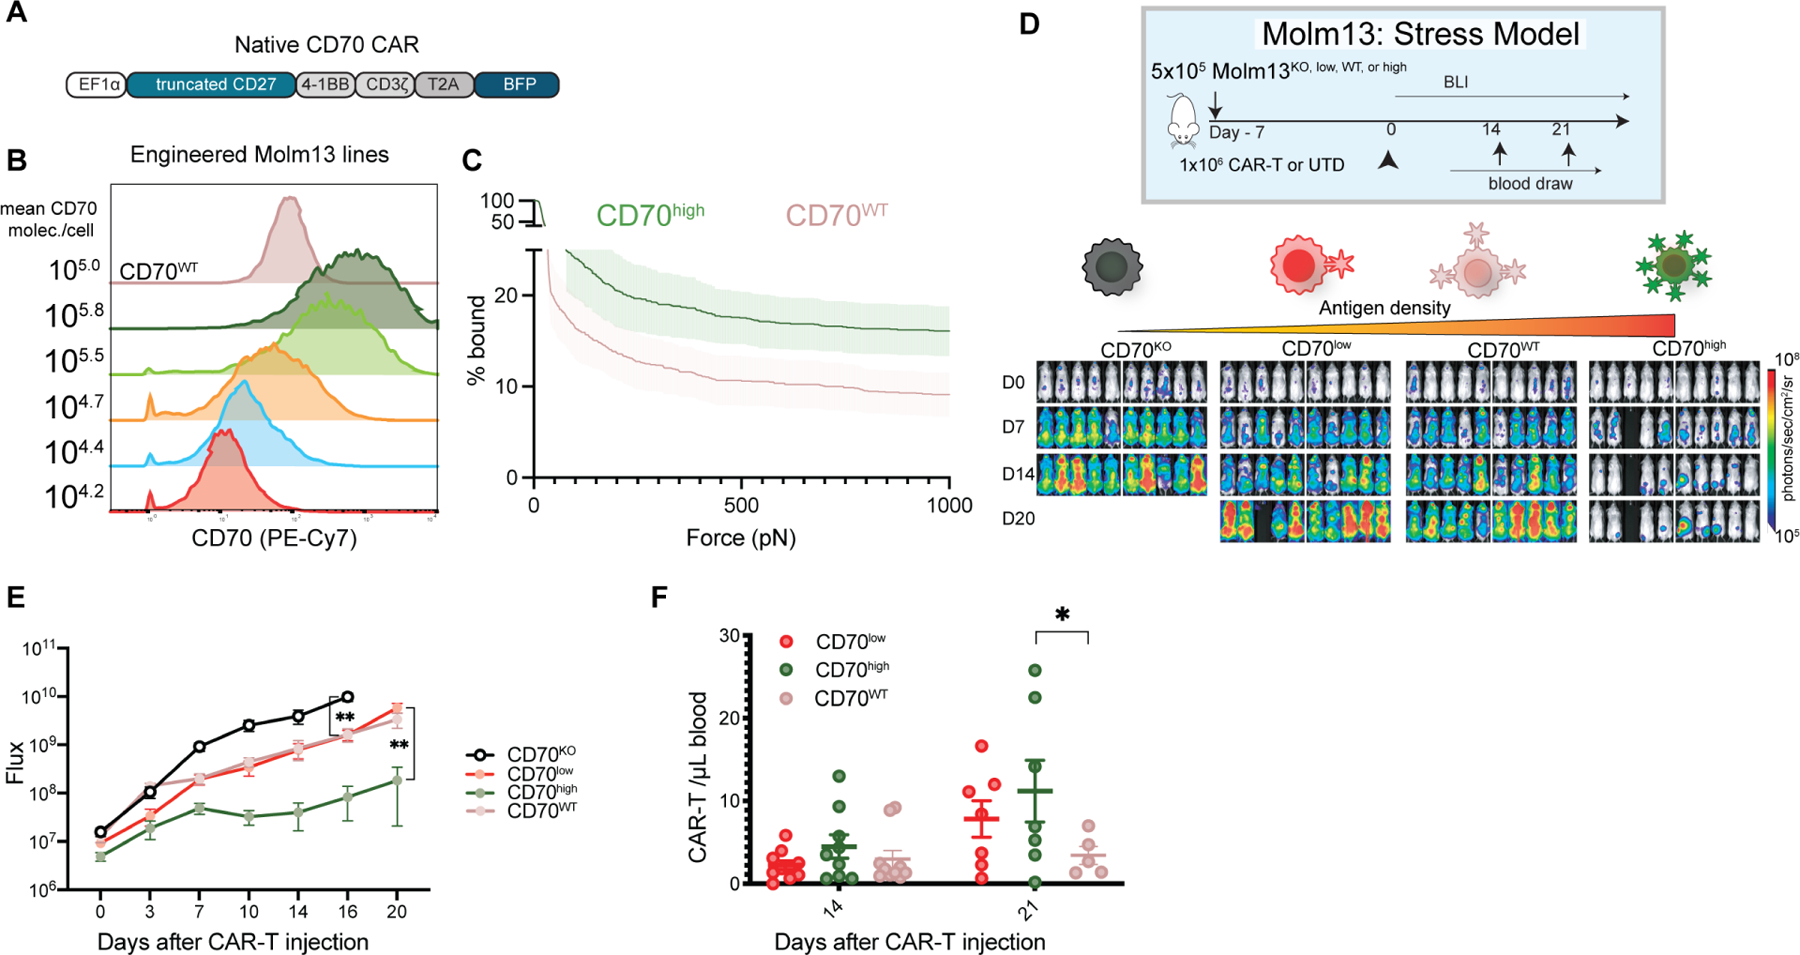
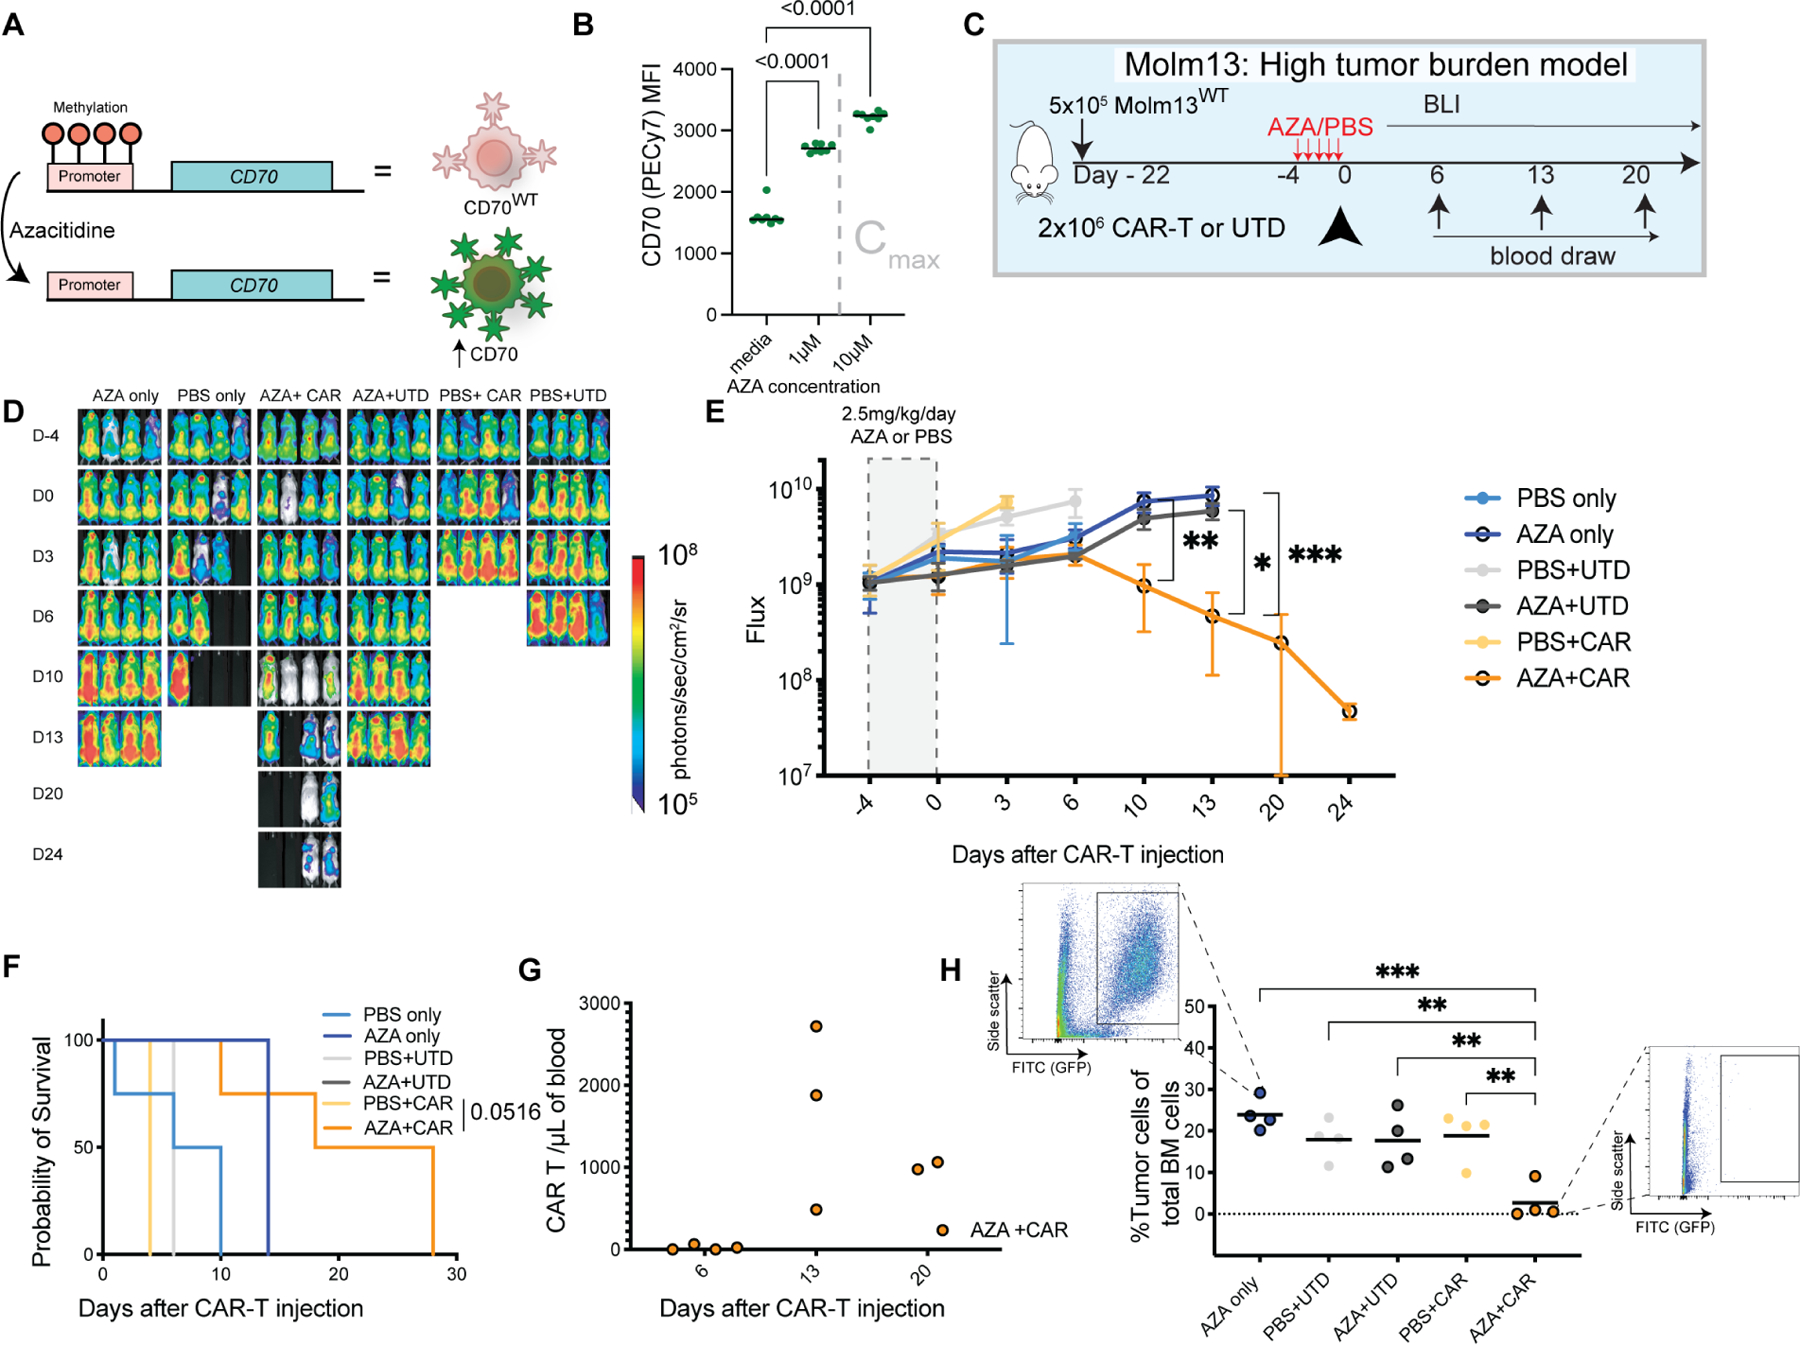
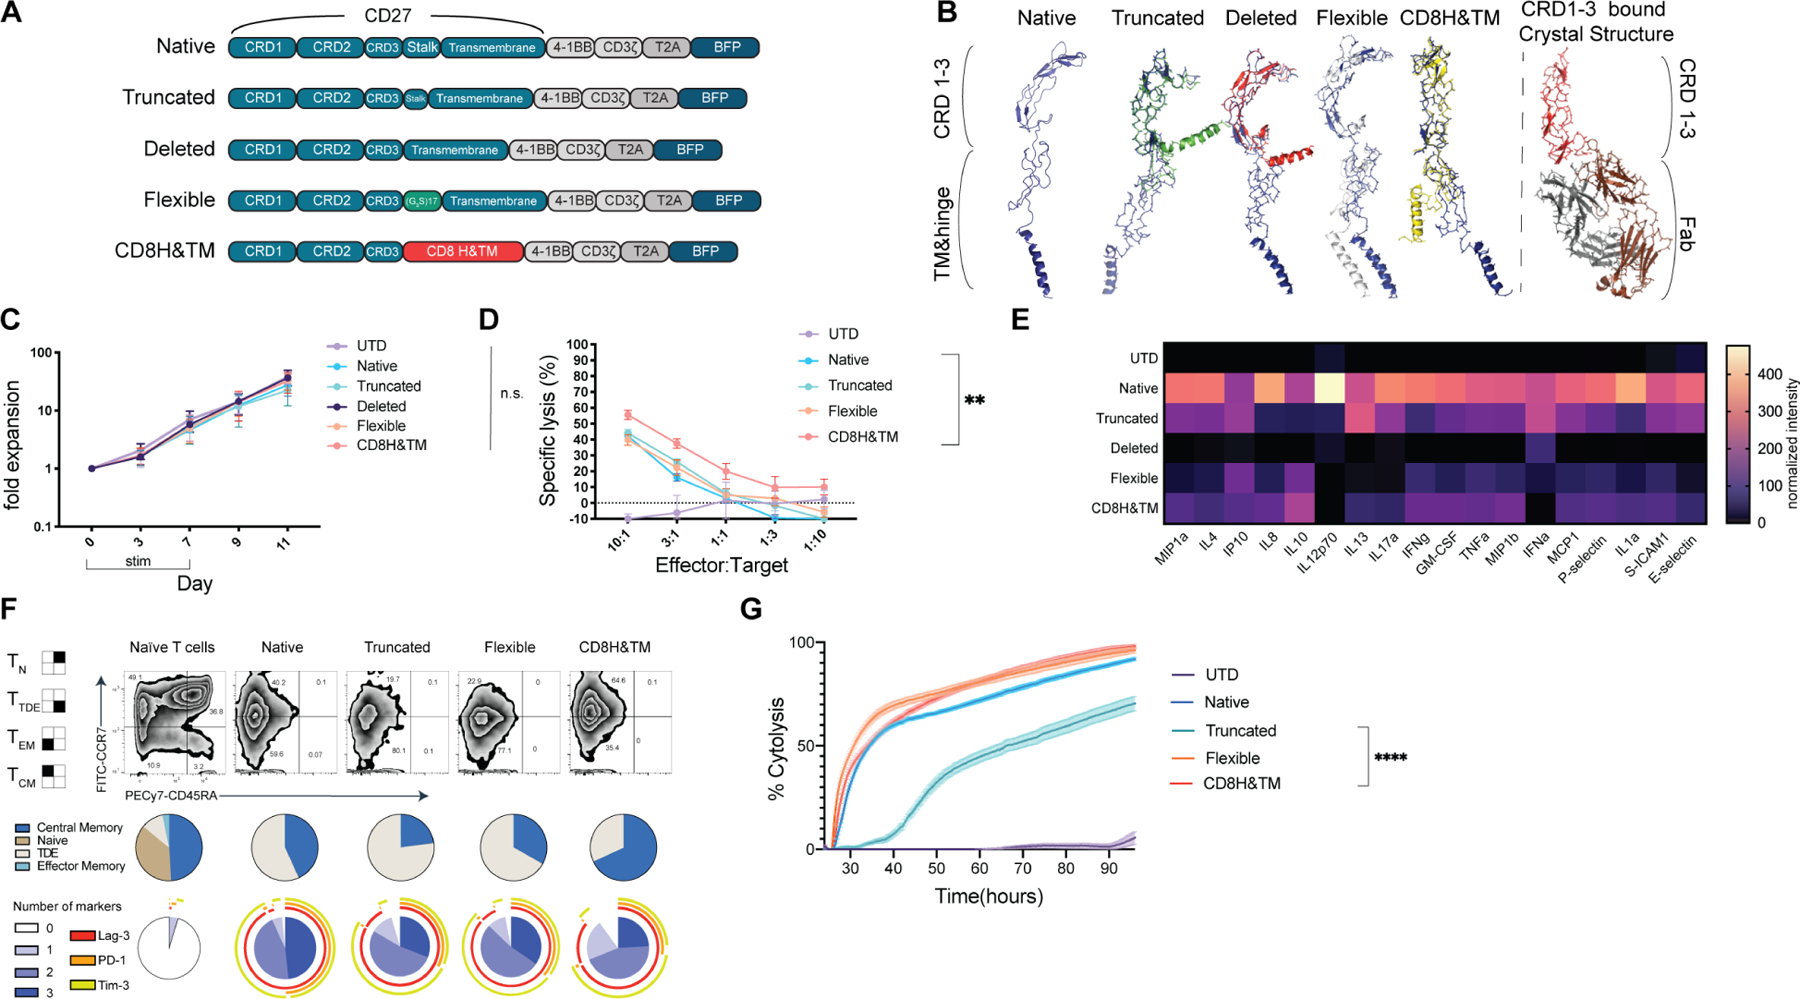
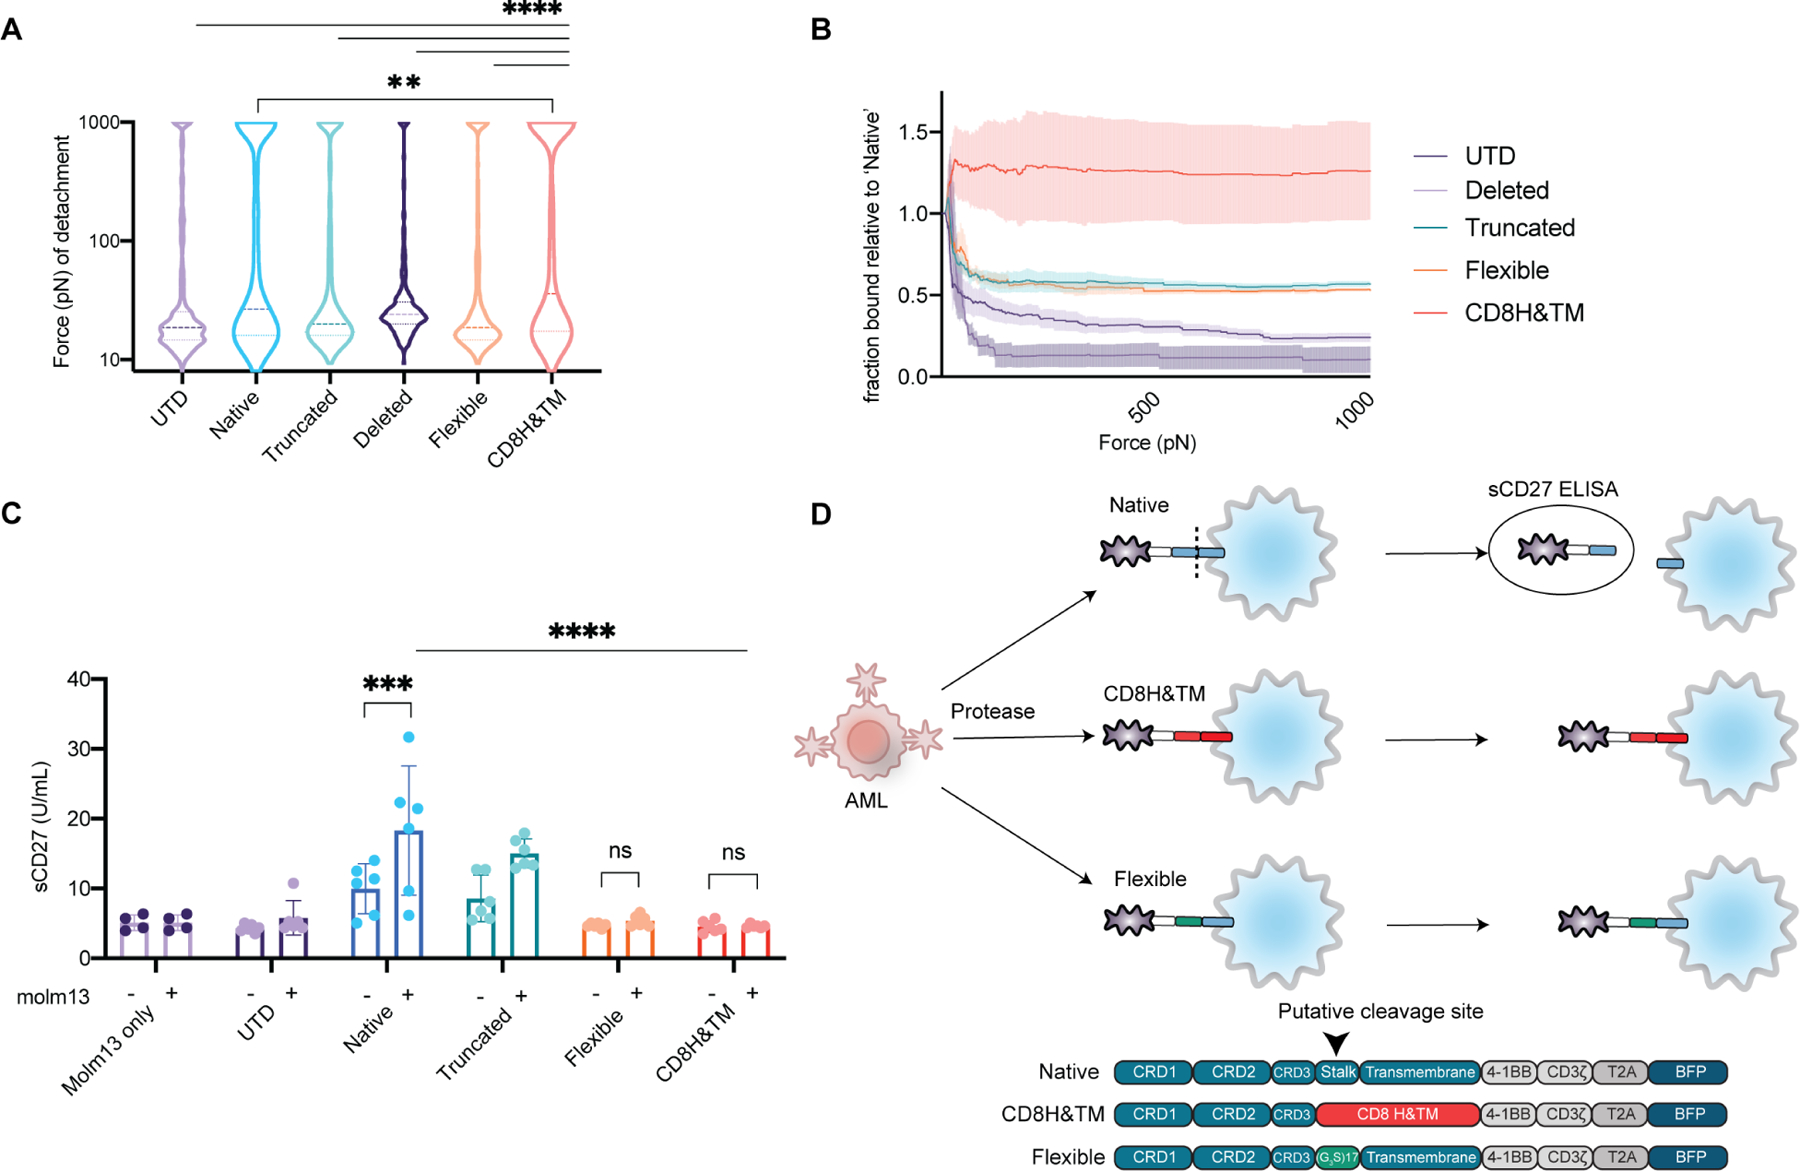
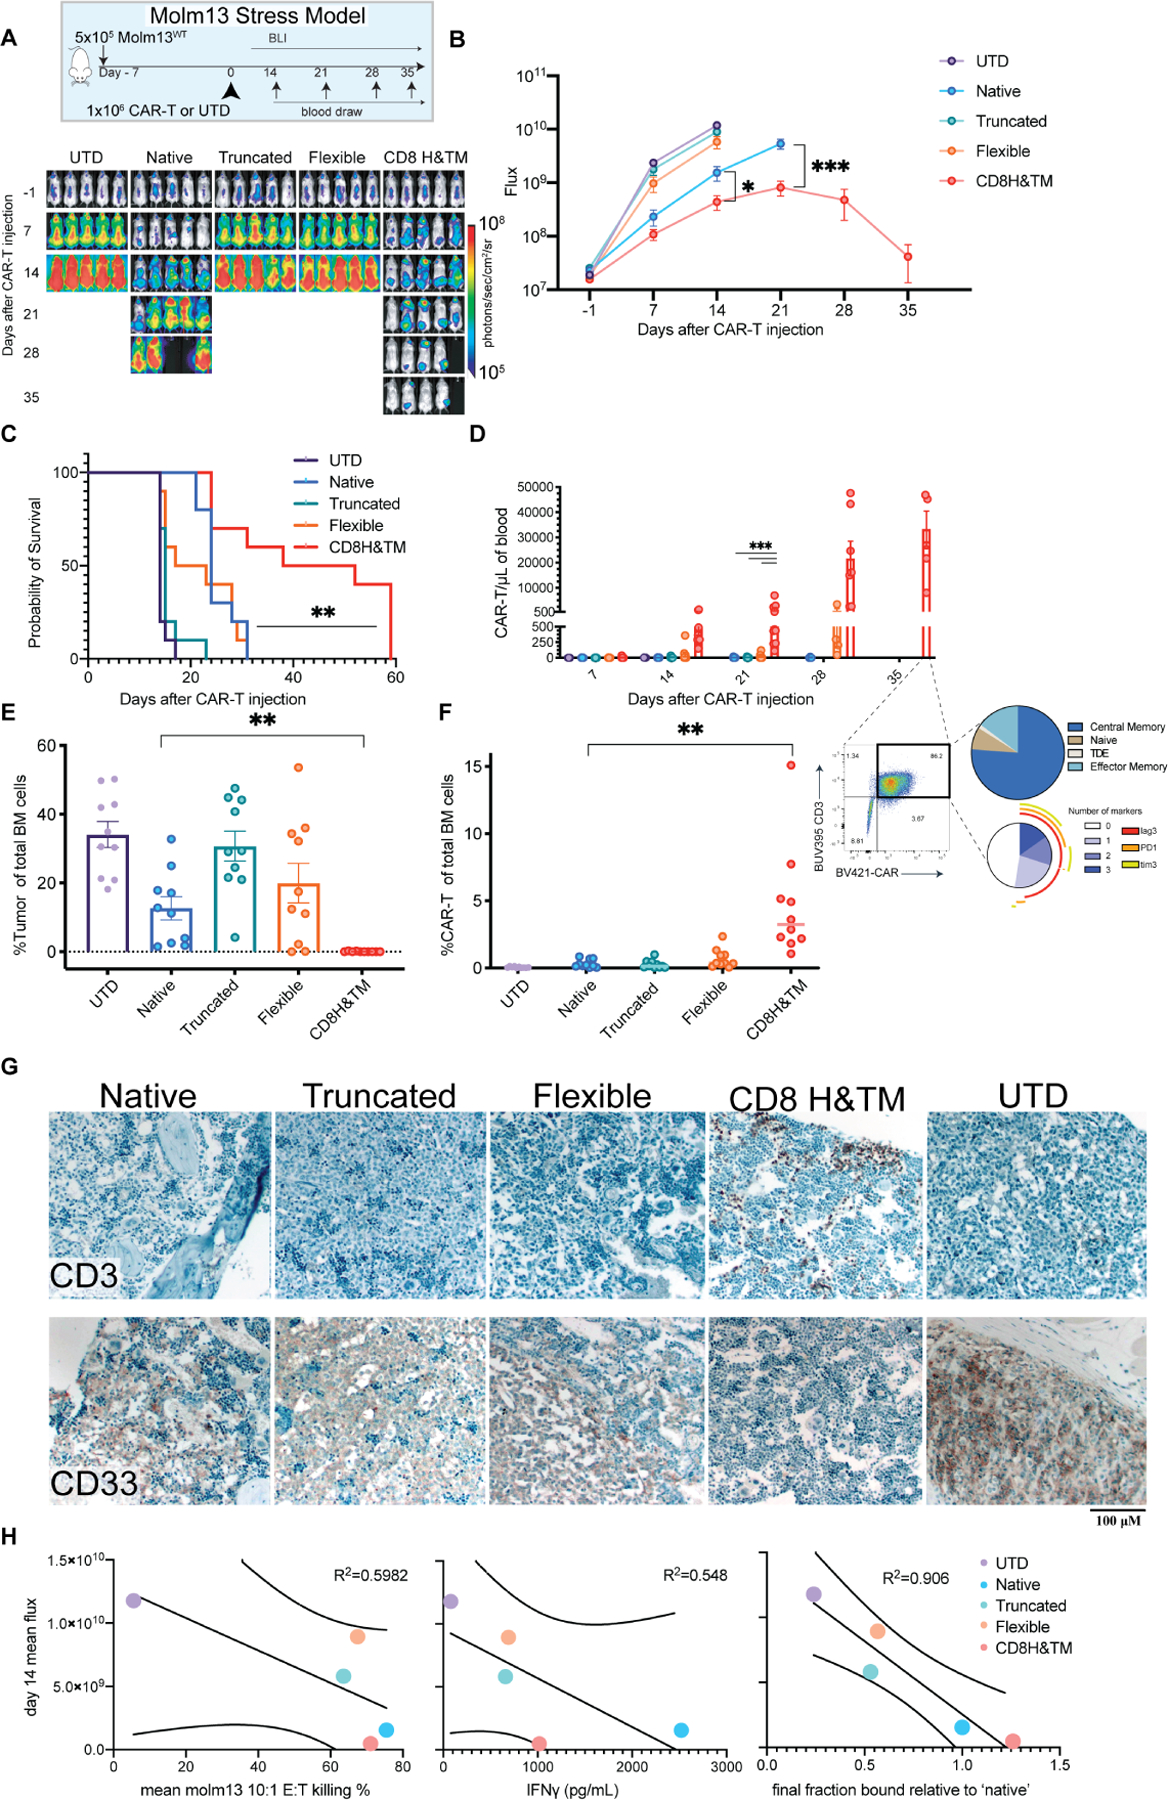
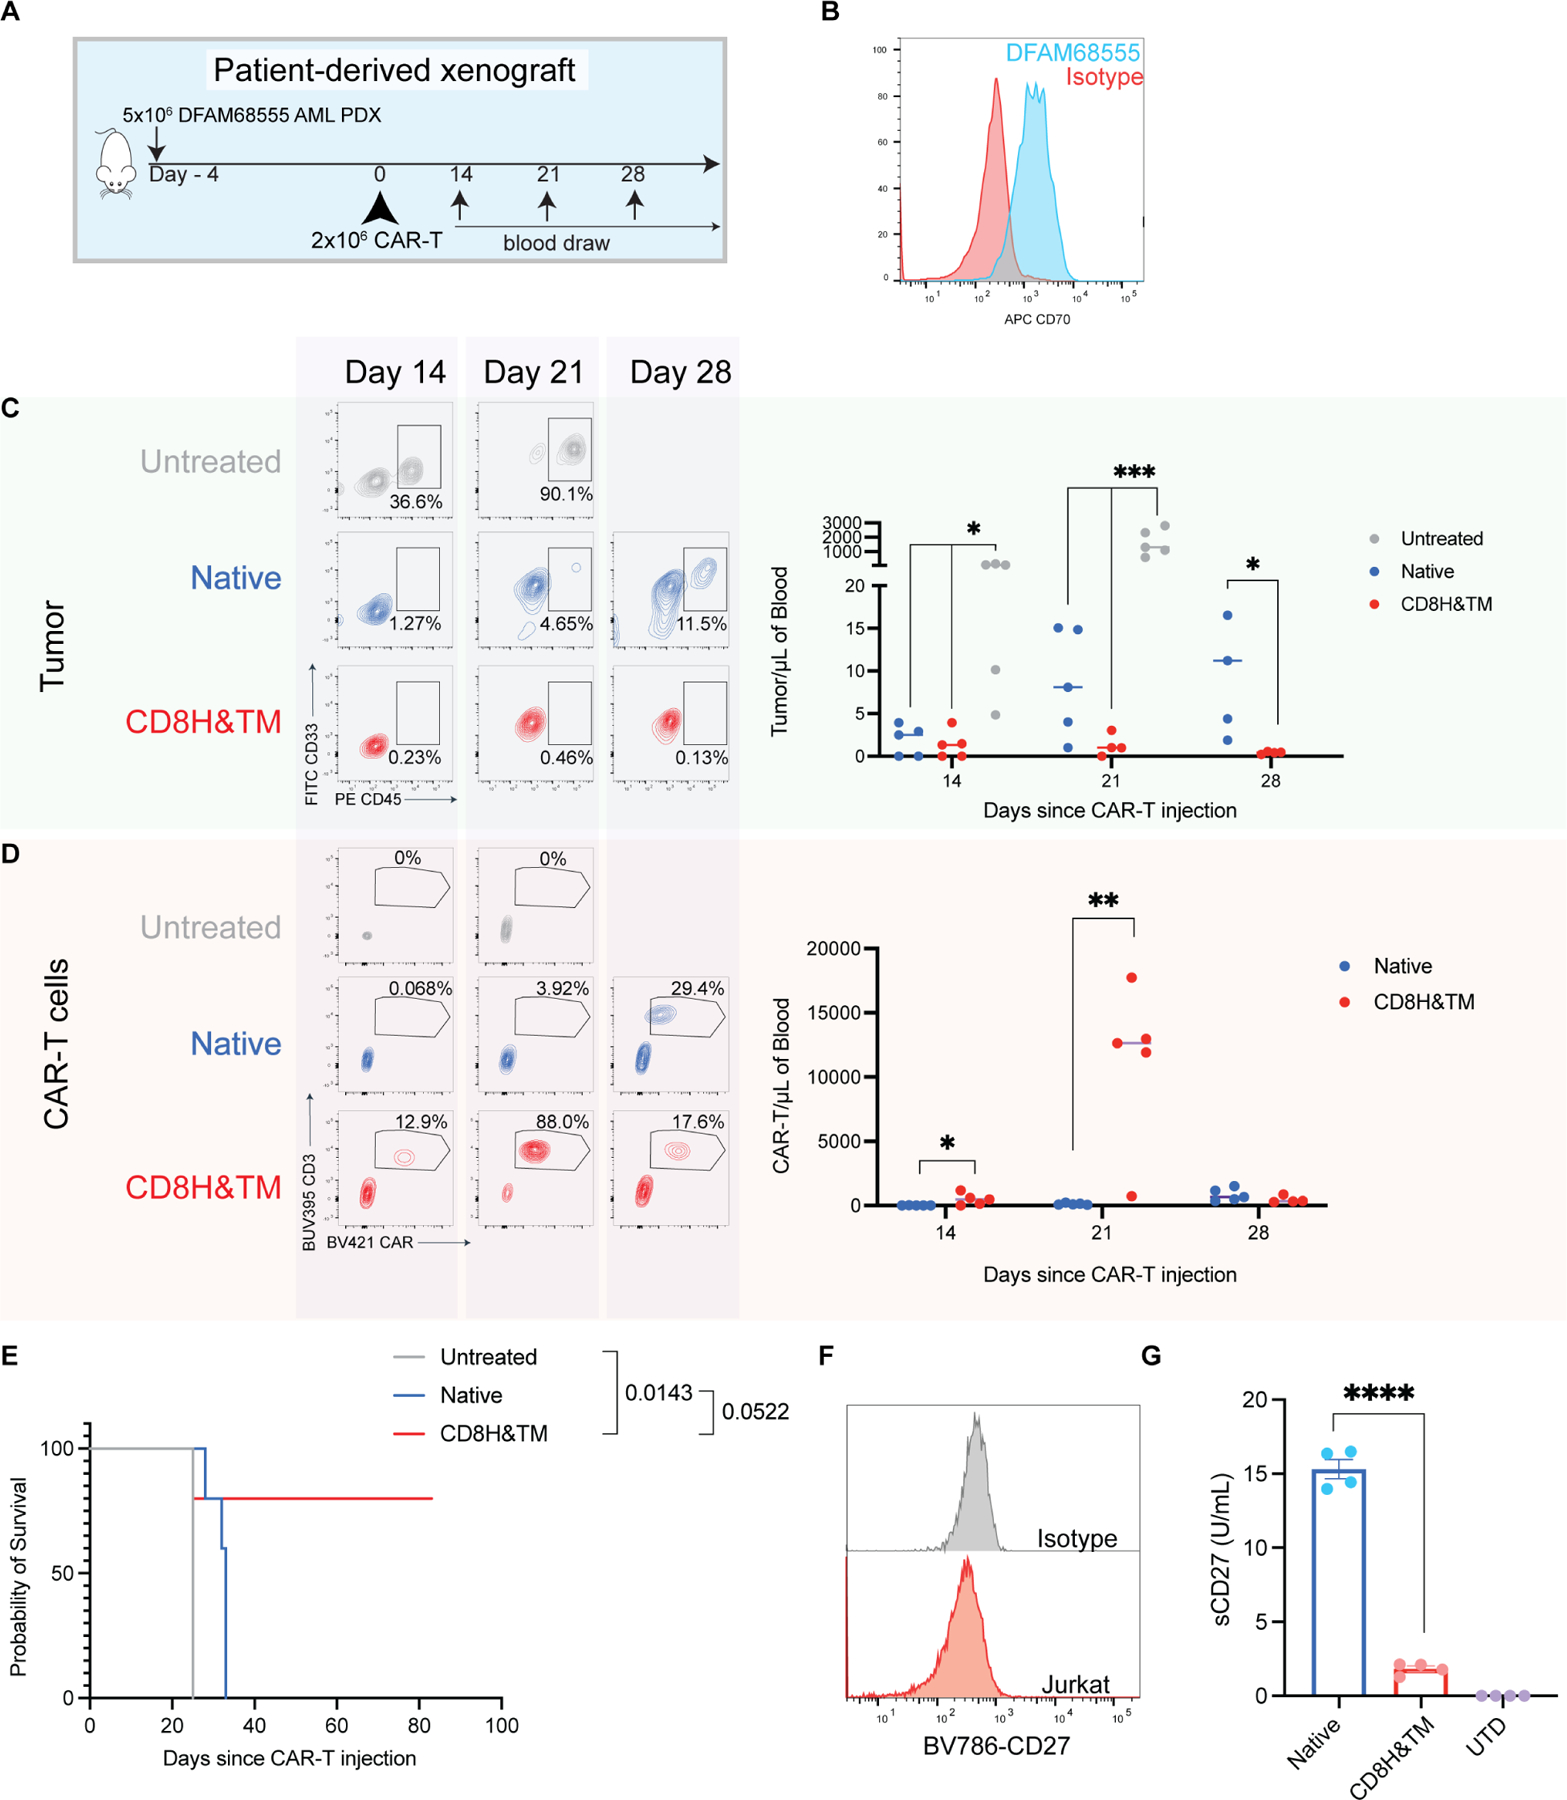
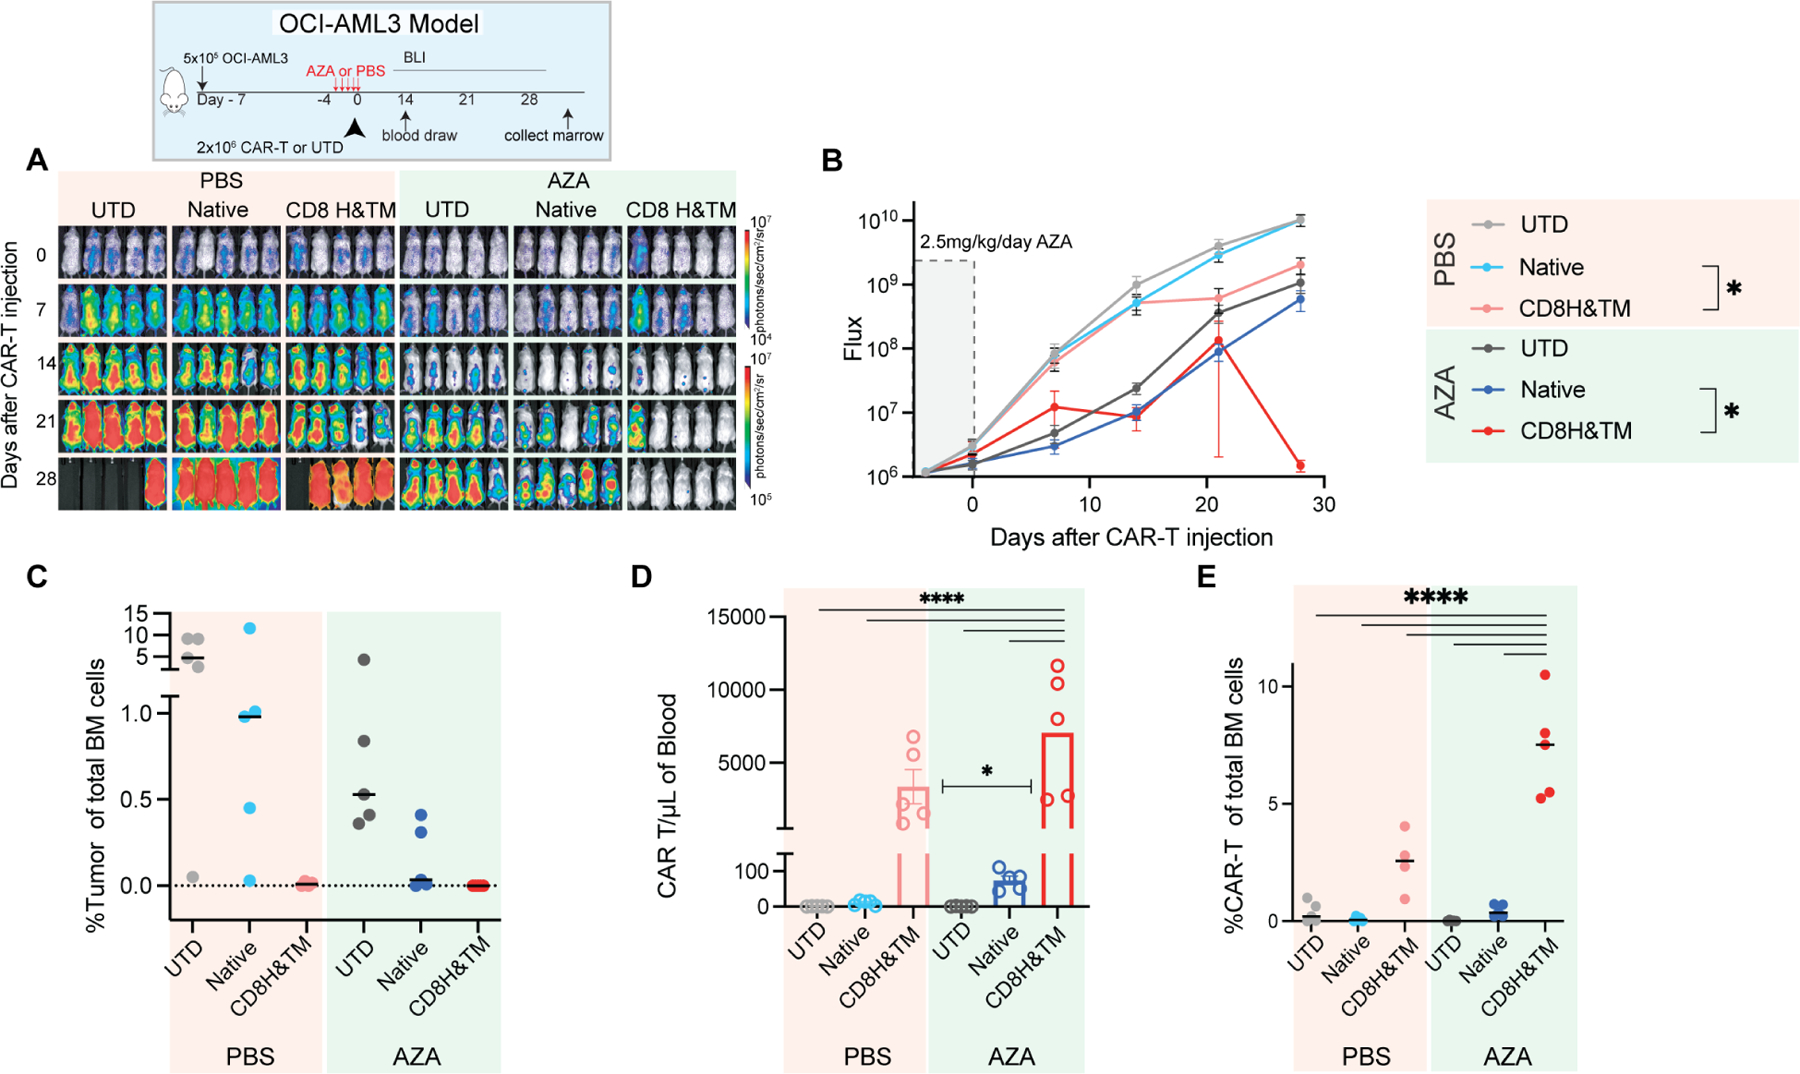
Chimeric antigen receptor (CAR) T cell therapy is effective in lymphoid malignancies, but there has been limited data in myeloid cancers. Here, we start with a CD27-based CAR to target CD70 ("native") in acute myeloid leukemia (AML), and we find modest efficacy in vivo, consistent with prior reports. We then use orthogonal approaches to increase binding on both the tumor and CAR-T cell sides of the immune synapse: a pharmacologic approach (azacitidine) to increase antigen density of CD70 in myeloid tumors, and an engineering approach to stabilize binding of the CAR to CD70. To accomplish the latter, we design a panel of hinge-modified regions to mitigate cleavage of the extracellular portion of CD27. Our CD8 hinge and transmembrane-modified CD70 CAR-T cells are less prone to cleavage, have enhanced binding avidity, and increased expansion, leading to more potent in vivo activity. This enhanced CD70-targeted CAR is a promising candidate for further clinical development.

Keywords: acute myeloid leukemia; adoptive T cell therapy; cell engineering; cellular immunity; chimeric antigen receptors; combined modality therapy; hematologic neoplasms.


Conflict of interest statement

Declaration of interests M.V.M. is an inventor on patents related to adoptive cell therapies, held by Massachusetts General Hospital (some licensed to Promab) and University of Pennsylvania (some licensed to Novartis). M.V.M. holds equity in 2SeventyBio, Century Therapeutics, Genocea, Neximmune, Oncternal, and TCR2 and has served as a consultant for multiple companies involved in cell therapies. M.V.M. is on the Board of Directors of 2Seventy Bio. M.V.M. has grant/research support from CRISPR therapeutics, Kite Pharma, Servier, and Novartis. M.J.F. has served as a consultant for several cell therapy companies. No other authors report conflicts of interest. M.B.L. and M.V.M. have filed patents on the constructs described herein.

Figures

Figure 1.
Figure 1.. Higher antigen density improves CD70-CAR-T cell avidity and activity
(A) trCD27–41BBζ, ‘native’ CD70-targeted CAR construct. (B) CD70 knockout Molm13 AML cells were transduced at various multiplicities of infection (MOI) with truncated CD70 lacking an intracellular signaling domain. Five populations were selected, and flow sorted for only CD70+ cells, generating five new cell lines, CD70 wild type (CD70WT), CD70 high (CD70high), CD70 high intermediate (CD70high-int), CD70 intermediate (CD70int), CD70 low intermediate (CD70low-int), and CD70 low (CD70low). CD70 expression by flow cytometry and number of molecules per cell are shown. (C) Immune synapse binding avidity to Molm13 CD70high or CD70WT targets assessed via acoustic force microfluidic microscopy. Data represents mean ± SEM and combined experiments from 4 separate microfluidic chips from separate donors. (D) Experimental setup: n=10 NSG mice per group were injected with 5×10⁵ cells from either Molm13 CD70KO, Molm13 CD70low (104.2 mol./cell), Molm13wt (105/mol./cell), or Molm13 CD70high (105.8 mol./cell) and then treated with 1×10⁶ native CAR-T-cells seven days later (day 0) in a stress model of AML. Images represent bioluminescence (BLI) at the indicated time points. (E) Quantification of flux (photons/second). Points represent mean ± SEM. ** p <0.01 by unpaired t test. Comparison between CD70low and CD70WT was 0.17 by unpaired t test. (F) CAR-T cell expansion in the peripheral blood at the indicated time points determined by flow cytometry (CD3+ BFP+). Lines represent mean ± SEM. * p< 0.05 by mixed-effects model using Sidak correction for multiple comparisons. Comparison between CD70low and CD70WT was 0.2318 by the same mixed effects model. Representative of n=1 experiment. See also Figures S1-S2.
Figure 2.
Figure 2.. Azacitidine augments CD70-CAR potency by increasing antigen expression on AML blasts in a high tumor burden model
(A) Mechanism of CD70 antigen increase after CD70 expression (Riether et al., 2020). (B) CD70 expression levels by flow cytometry after Molm13 exposure to the indicated concentrations of azacitidine for 72 hours. Gated on live (DAPI-) cells. Cmax represents the maximal concentration in humans after a single dose of 75mg/m2 (Actavis_Pharma). Representative of n=3 independent experiments. Horizontal lines represent the median. (C) Experimental setup: NSG mice were injected with 5×10⁵ Molm13 on day −22 (n=4 mice per group). After prolonged tumor engraftment and randomization, mice received intraperitoneal injections of 2.5mg/kg/day azacitidine or vehicle (PBS) starting on day −4. On day 0 they were treated with either: no intervention, a single dose of 2 ×10⁶ native CD70-targeted CAR-T-cells, or the equivalent number of untransduced T cells (UTD). (D) BLI of AML xenografts over time in the indicated groups. (E) Quantification of flux [photons/second] in the experimental groups at the indicated time points. Points represent mean ± SEM. * p< 0.05, ** p<0.01, *** p<0.001 by mixed effect model and Dunnett’s correction for multiple hypotheses. (F) Kaplan-Meier survival curves of the treatment groups. P-value as shown for AZA+CAR comparison to PBS+CAR control p by Log-rank (Mantel-Cox) test with Bonferroni correction. (G) Quantification of CAR-T-cells (CD3+ BFP+) measured in the peripheral blood by flow cytometry at the indicated time points. (H) Percentage of GFP positive cells in the femur at the time of death or euthanasia as assessed by flow cytometry gated as shown which were representative of the identified conditions. Bars represent the mean. ** p< 0.01, *** p< 0.001 by one-way ANOVA with Dunnett’s correction for multiple hypotheses to the AZA+CAR condition. Representative of n=2 independent experiments. See also Figure S3.
Figure 3.
Figure 3.. Most hinge variants have comparable in vitro cytolytic capacity and expansion relative to the native CAR.
(A) Construct designs for CD70-targted CAR hinge variants. (B) Predicted structure of the CD70-targeted CAR cysteine rich domains (CRDs) as well as the hinge and transmembrane domains using the Phyre2 (Kelley et al., 2015) predictive engine with each aligned in Pymol3 with the MUSCLE plugin to the Native CRD (blue structure). Published crystal structure for CRD 1,2, & 3 is shown for comparison binding to a Fab. (C) CD70 hinge variant CAR expansion after lentiviral transduction. All differences are nonsignificant (ns) by 2-way ANOVA with Dunnett’s correction for multiple hypotheses. Points represent mean ± SEM of T-cells from 3 healthy donors. (D) Cytotoxicity as assessed in a luciferase-based killing assay for 16hrs with the indicated CAR and OCI-AML3 target. Data points indicate mean ± SEM of technical triplicates also performed in biological triplicate with T-cells derived from 3 healthy donors. * p< 0.05, **** p< 0.0001 by one-way ANOVA with Dunnett’s multiple hypotheses correction at the 10:1 E:T ratio compared to the native CAR. (E) Heatmap of normalized cytokines in the supernatants of CD70-CAR hinge variants after overnight co-culture with Molm13 at a 1:1 ratio. Cytokines were measured by Luminex assay in technical duplicates and biological triplicate with T cells derived from 3 healthy donors. Representative of n=1 independent experiment. (F) CD70-CAR hinge variants were stimulated with 5 doses of weekly CD70-expressing irradiated K562s at a 1:1 ratio and assessed at day 28 for phenotype and exhaustion markers. T cells from the corresponding unstimulated healthy donor are shown for comparison. Exhaustion markers from naïve T cells from the same unstimulated healthy donor are shown for reference. Performed in 3 independent donors, data is representative of a single donor. (G) The same CARs from day 28 were used in a real-time cytotoxicity assay against Molm13 targets at a 1:1 effector: target ratio (relative to Day 0 tumor seeding). Assay performed in quadruplicate. Means are plotted ± SEM. **** p <0.0001 by one-way ANOVA assessed at the terminal time point. See also Figure S4.
Figure 4.
Figure 4.. Decreased proteolytic cleavage of the CD8H&TM CD70-CAR results in enhanced binding avidity.
(A) CD70-targeted CAR hinge variants immune synapse binding affinity to Molm13 targets assessed via acoustic force microfluidic microscopy. Solid line represents median with dotted lines representing quartiles. Data represents combined experiments from at least 3 separate microfluidic chips over separate days comprising at least 330 effector-target binding events. **p <0.01, **** p <0.001 by Mixed-effects analysis with Dunnett’s multiple comparisons test to CD8H&TM. (B) Fraction of cells bound relative to the native CD70 CAR from (A) as a function of applied acoustic force. Curves represent mean ± SEM. (C) Supernatant from CD70-CAR hinge variants or UTDs in the presence or absence of Molm13 was obtained at a 1:1 ratio from overnight co-culture and assayed for soluble CD27 in an ELISA. Assay performed technical duplicates and biological triplicate with T cells derived from 3 healthy donors. Bars represent mean ± SEM. *** p<0.001, **** p<0.0001 by separate 2-way ANOVA tests (+/− Molm13 for each CAR, and between CARs) with Dunnette’s and Sidak’s multiple hypotheses correction respectively. Differences between CARs for the Molm13 absent conditions were non-significant. (D) Schematic of the assay and proposed mechanism from (C). See also Movie S1.
Figure 5.
Figure 5.. Avidity-enhanced CD8H&TM CD70 CARs have increased tumor control and proliferation in a stress model of AML
(A) Mice were engrafted with 5×10⁵ Molm13 cells on day −7. On day 0, ten mice per group received 1×10⁶ CAR-T cells from the indicated CD70-CAR hinge variant or UTD. Experiment completed with two separate biological donors. Representative of n=1 experiment. (B) Quantitative flux measurements * p< 0.05, *** p <0.001 by unpaired T-test. Points represent mean ± SEM. (C) Survival ** p<0.01 Native compared to CD8H&TM by log-rank (Mantel-Cox) with Bonferroni correction. (D) Weekly CAR-T cell expansion assessed by flow cytometry. Bars represent mean ± SEM. *** p<0.001 by 2-way ANOVA with Dunnett’s multiple hypotheses correction. Representative T cell subsets and exhaustion markers are shown at day +35. (E) Bone marrow tumor burden assessed by flow cytometry as a percentage of total single cells in the marrow. Bars represent mean ± SEM. ** p <0.01 by unpaired T-test (F) CAR-T-cells as fraction of total bone marrow cells. Lines represent the median. ** p <0.01 by unpaired T-test. (G) Representative immunohistochemistry for the indicated markers is shown. Images underwent individual white balancing correction using the white balance correction_1.0 plugin for ImageJ. Identical brightness and contrast adjustment applied to all images to improve clarity. (H) Correlations between mean peak flux for each in vivo experimental group for which all groups were still evaluable (day +14) and remaining bound cells relative to the native CAR-T cells after maximal force application in the avidity experiments from figure 3, mean in vitro Molm13 killing at a 10:1 ratio, and mean IFNγ production after Molm13 co-culture are shown. R2 value represents a linear regression goodness of fit, lines represent 95% confidence bands of the best fit line. See also Figures S5.
Figure 6.
Figure 6.. CD8H&TM but not native CD70 CAR-T cells eradicate AML in a PDX model
(A) Experimental schema: Mice were engrafted with 5×10⁶ DFAM68555 AML PDX cells from an adult AML patient with monocytic, therapy-related AML on day −4. On day 0 they received no treatment or 2×10⁶ of either native or CD8H&TM CAR-T cells and underwent weekly blood draws to monitor tumor (CD33+CD45+) and CAR-T (CD3+BFP+) expansion in the blood. (B) DFAM68555 CD70 expression relative to isotype control. (C,D) Representative tumor (C) and CAR (D) expansion at the indicated time points * p <0.05 by one-way ANOVA with Dunnett’s correction for multiple comparisons, *** p<0.001 by one-way ANOVA with Dunnett’s correction for multiple comparisons, * p<0.05 and ** p<0.01 both by unpaired T-test. Horizontal lines represent the median. (E) Kaplan-Meier survival curve. P values by Mantel-Cox test shown for the indicated comparisons without multiple hypotheses correction. (F) Jurkat T cells were assessed via flow cytometry for CD27 expression. (G) Jurkat T cells were transduced with the indicated CAR-T cells and co-cultured overnight at a 1:1 ratio with Molm13. Supernatant was assayed for sCD27 via ELISA. **** p <0.0001 by unpaired t test. Representative of n=1 independent experiment. Bars represent mean ± SEM.
Figure 7.
Figure 7.. Avidity enhanced CD8H&TM CARs outperform native CD70 CARs and eradicate tumor when combined with azacitidine.
(A) NSG mice were injected with 5×10⁵ OCI-AML3 AML cells and tumor burden was monitored by BLI. After tumor engraftment and randomization, mice received IP injections of 2.5mg/kg/day AZA starting on day −4 for a duration of 5 days. On day 0 they were treated with the indicated effector cell at a dose of 2×10⁶. On day 30 all mice were sacrificed, and bone marrow was evaluated via flow cytometry for tumor and CAR-T cells. (B) Quantification of flux [photons/second] in the experimental groups at the indicated time points. Mean ± SEM is shown. * p< 0.05 by unpaired T-test. (C) Bone marrow tumor burden assessed by flow cytometry as a percentage of total single cells in the marrow. Lines represent the median. (D) Quantification of CAR-T cells (CD3+ BFP+) measured in the peripheral blood by flow cytometry at day 14. Bars represent mean ± SEM. * p<0.05, **** p<0.0001 by one-way ANOVA with Dunnett’s multiple comparisons test. (E) CAR-T cells as percentage of total bone marrow cells. Lines represent median. **** p <0.0001 by one-way ANOVA with Dunnett’s multiple comparisons test. Representative of n=1 independent experiment. See also Figure S6.

Comment in

References

    1. Abramson JS, Palomba ML, Gordon LI, Lunning MA, Wang M, Arnason J, Mehta A, Purev E, Maloney DG, Andreadis C, et al. (2020). Lisocabtagene maraleucel for patients with relapsed or refractory large B-cell lymphomas (TRANSCEND NHL 001): a multicentre seamless design study. The Lancet 396, 839–852. 10.1016/S0140-6736(20)31366-0. - DOI - PubMed
    1. Actavis_Pharma, S.P.S. Azacitidine [package insert] U.S. Food and Drug Administration
    1. Alabanza L, Pegues M, Geldres C, Shi V, Wiltzius JJW, Sievers SA, Yang S, and Kochenderfer JN (2017). Function of Novel Anti-CD19 Chimeric Antigen Receptors with Human Variable Regions Is Affected by Hinge and Transmembrane Domains. Mol Ther 25, 2452–2465. 10.1016/j.ymthe.2017.07.013. - DOI - PMC - PubMed
    1. Bonifant CL, Szoor A, Torres D, Joseph N, Velasquez MP, Iwahori K, Gaikwad A, Nguyen P, Arber C, Song X-T, et al. (2016). CD123-Engager T Cells as a Novel Immunotherapeutic for Acute Myeloid Leukemia. Molecular Therapy 24, 1615–1626. 10.1038/mt.2016.116. - DOI - PMC - PubMed
    1. Boroughs AC, Larson RC, Marjanovic ND, Gosik K, Castano AP, Porter CBM, Lorrey SJ, Ashenberg O, Jerby L, Hofree M, et al. (2020). A Distinct Transcriptional Program in Human CAR T Cells Bearing the 4–1BB Signaling Domain Revealed by scRNA-Seq. Molecular therapy : the journal of the American Society of Gene Therapy 28, 2577–2592. 10.1016/j.ymthe.2020.07.023. - DOI - PMC - PubMed

Publication types

Substances