. 2022 May 9;40(5):479-493.e6.
doi: 10.1016/j.ccell.2022.03.012. Epub 2022 Apr 21.

A phenotypic signature that identifies neoantigen-reactive T cells in fresh human lung cancers

Affiliations

A phenotypic signature that identifies neoantigen-reactive T cells in fresh human lung cancers

Ken-Ichi Hanada et al. Cancer Cell. .

Abstract

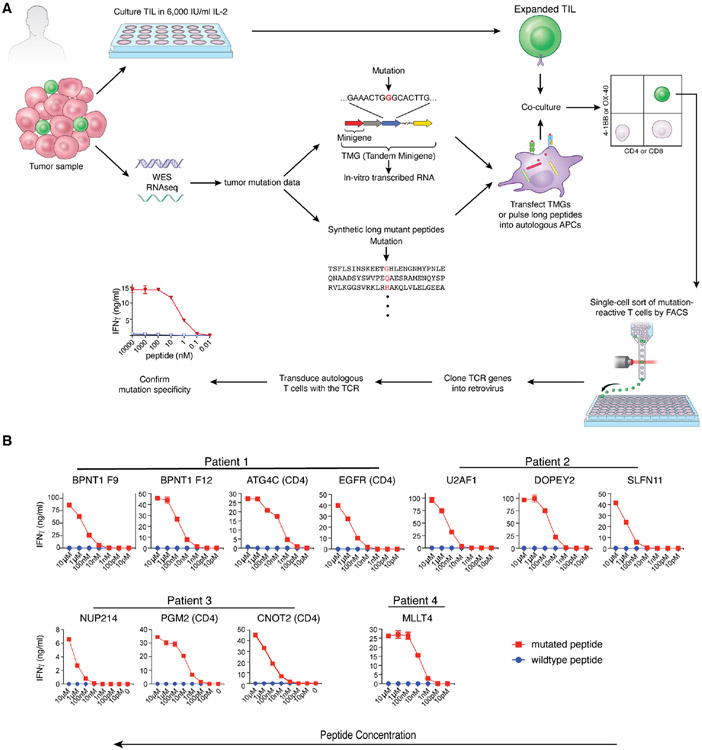
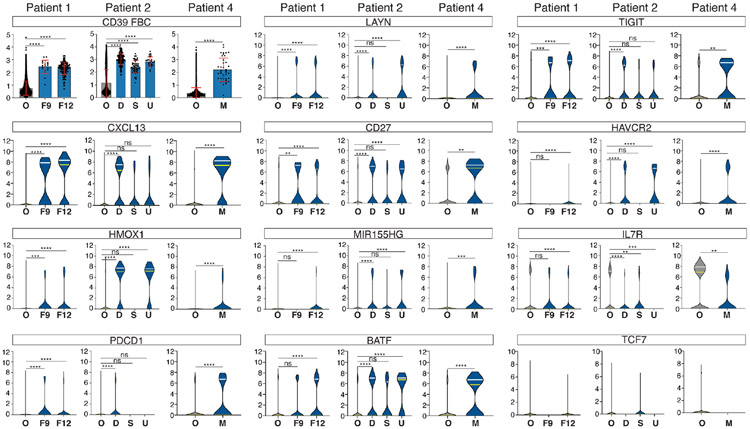
A common theme across multiple successful immunotherapies for cancer is the recognition of tumor-specific mutations (neoantigens) by T cells. The rapid discovery of such antigen responses could lead to improved therapies through the adoptive transfer of T cells engineered to express neoantigen-reactive T cell receptors (TCRs). Here, through CITE-seq (cellular indexing of transcriptomes and epitopes by sequencing) and TCR-seq of non-small cell lung cancer (NSCLC) tumor-infiltrating lymphocytes (TILs), we develop a neoantigen-reactive T cell signature based on clonotype frequency and CD39 protein and CXCL13 mRNA expression. Screening of TCRs selected by the signature allows us to identify neoantigen-reactive TCRs with a success rate of 45% for CD8+ and 66% for CD4+ T cells. Because of the small number of samples analyzed (4 patients), generalizability remains to be tested. However, this approach can enable the quick identification of neoantigen-reactive TCRs and expedite the engineering of personalized neoantigen-reactive T cells for therapy.

Keywords: CD39; CITE-seq; CXCL13; NSCLC; TILs; adoptive cell transfer therapy; neoantigens; single-cell analysis; tumor-infiltrating lymphocytes.


Conflict of interest statement

Declaration of interests The authors declare no competing interests. A non-provisional international patent has been filed based on the work described in this study.

Figures

Figure 1
Figure 1. Isolation of neoantigen-reactive T cell receptors by the conventional method
(A) Procedure for isolating neoantigen-reactive TCRs. Resected tumor samples were used for two purposes. One was for growing TIL and the other was for performing Whole Exome Sequencing (WES) and RNA-seq to identify tumor-specific mutations. Based on the mutation data, Tandem Minigenes (TMGs), containing a string of genes that encode 25 amino acids surrounding the mutation, were created for the presentation on class I MHC. TMGs are transcribed in vitro, and the RNA was introduced into the autologous dendritic cells by electroporation. For the class II MHC pathway presentation, 25-mer peptides, the center of which were mutated amino acids, were synthesized and were exogenously pulsed onto dendritic cells. These dendritic cells served as surrogate tumor cells and were co-cultured with expanded TIL. When TIL recognized a mutation, they up-regulated activation markers such as 4-1BB and OX-40. These activated T-cells were single-cell sorted by FACS, and the TCR genes were amplified by a PCR-based method. After cloning into a retrovirus vector, TCR genes were retrovirally transduced to the autologous T-cells. Their specificity was confirmed by co-culturing with DC presenting the mutated or the wildtype peptide. T-cell activation was measured by IFNγ ELISA. (B) Cognate peptides (mutated or wildtype) were pulsed onto autologous dendritic cells (CD8: 9-mer or 10-mer, 2 hours at RT, CD4: 25-mer, 3 hours at 37°C). After the incubation, dendritic cells were washed three times, and the TCR-transduced autologous T-cells were added. After 20-hour co-culture, IFNγ in the culture sup was measured by ELISA.
Figure 2
Figure 2. Identification of genes and proteins expressed on neoantigen-reactive T cells isolated by the conventional TIL screening
Comparative gene and protein expression analysis of neoantigen-reactive T-cell clonotypes and putative non-reactive CD8+ T cells. (A) Genes and proteins with (Fold)2≥4 differences and FDR≤0.01 were selected and shown in the Venn diagram by numbers. (B) 24 genes or proteins commonly up- or down-regulated among three patients. (C) Dot plots of cell surface proteins as analyzed by FBC antibodies. (Patient 1, blue dots: BPNT1-reactive clone F9, red dots: BPNT1-reactive clone F12, Patient 2, red dots: DOPEY2-reactive clone, orange dots: SLFN11-reactive clone, blue dots: U2AF1-reactive clone, patient 4, red dots: MLLT4-reactive clone, Black dots: other CD8 T-cells in all the patients.) See also related Figure S1.
Figure 3
Figure 3. Analysis of gene and protein expression on neoantigen-reactive T cells at the clonotype level
Clonotype-level comparisons of representative gene and protein expression that were selected in Figure 2. Protein expression (CD39 FBC) is shown by the dot and bar plot and gene expressions by violin plots. In dot and bar plots, the mean is shown by bars and ±1 SD by error bars. (O: other CD8 T cells, F9: BPNT1-reactive TIL clone F9, F12: BPNT1-reactive TIL clone F12, D: DOPEY2 reactive TIL clone, S: SLFN11-reactive TIL clone, U: U2AF1-reactive TIL clone, M: MLLT4-reactive TIL clone) Statistical analysis was done by one-way ANOVA and Dunnett’s multiple comparison test for patients 1 and 2 and by unpaired t-test for patient 4. In violin plots, statistical analysis was done for patients 1 and 2 by Kruskal-Wallis test and Dunn’s multiple comparison test and patient 4 by Mann-Whitney test. (ns P>0.05, * P≤0.05, ** P≤0.01, *** P≤0.001, **** P<0.0001)
Figure 4
Figure 4. Simple signature of expression of CD39 protein, CXCL13 transcript and high-frequency clonotype identifies CD8+ neoantigen-reactive T cells at high frequency
(A and B) tSNE plots based on the cell surface protein expression data. Cell number and frequency in CD8+ T cells are shown in each box. (A) blue dots: CD8+, CD39, red dots: CD8+, CD39+, gray dots: CD4+ T-cells (B) blue dots: CD8+, CXCL13, red dots: CD8+, CXCL13+, gray dots: CD4+ T-cells (C) T-cell clonotype frequency in TIL as measured by single-cell TCR analysis (Red bars: neoantigen-reactive clonotypes, Blue bars: CD39 clonotypes, Gray bars: CD39+, CXCL13+ but not neoantigen-reactive) (D) T-cell clonotype frequency in PBL as measured by TCRβ deep sequencing. Total numbers of CDR3B were patient 1: 125,214, patient 2: 266,713, patient 3: 194,454, and patient 4: 318,838. (E) CXCL13 mRNA expression (yellow line: median, white lines: upper or lower quartile) (F) Test on neoantigen-specific reactivity by synthetic 9-mer peptides. Details on TCRs and peptides used for the assay are provided in the supplementary Table 3. The assay was performed in the same way as Figure 1B. (G) Identification of neoantigen-reactive TCRs in higher PD1 protein-expressing clonotypes. Red bars are neoantigen-reactive clones.
Figure 5
Figure 5. CD39+, CXCL13+, high-frquency clonotype signature also identifies CD4+ neoantigen-reactive T cells
(A) Cell-surface protein-based tSNE plot of TIL from patient 1. Light blue dots indicate CD4+ T cells, red dots indicate EGFR-reactive CD4+ T cells, large blue dots indicate ATG4C-reactive CD4+ T cells. (B) Volcano plot showing the differentially expressed genes between the orange cluster and other CD4+ T-cells shown in (A). (C, G, L and Q) tSNE plots showing CD4+ cells by blue dots and CD39 protein-, CXCL13-, TIGIT-, and FOXP3-expressing cells by red dots. Frequency of cells in total CD4+ cells is shown by %. (D) Cell number of the candidate clonotypes within the orange cluster shown in (A), (red bars: neoantigen reactive, blue bars: non-reactive). (E, J and O) CXCL13 expressions in T-cell clones analyzed. (F, K and P) Neoantigen reactivities of TCR-transduced autologous T-cells were examined by co-culturing these cells with autologous dendritic cells pulsed with cognate mutated or wildtype 25-mer peptides. After a 20-hour co-culture, T-cell activation was examined by measuring IFNγ in the cell culture sup by ELISA. (H and M) clonotype frequency of TCRs analyzed within CD3+ TIL (light blue CD39, red: CD39+ CXCL13+ and neoantigen-reactive, dark blue CD39+ CXCL13+ but not neoantigen-reactive). (I and N) Frequencies of candidate clonotypes in PBL measured by TRBV deep sequencing. (R) Expression of CD39 protein and CXCL13 in the four clonotypes tested for neoantigen-reactivity. All the tSNE plots in Figure 5 are cell surface protein-based.
Figure 6
Figure 6. Neoantigen-reactive T cell signatures designed by cell surface protein expression and gene expression show high sensitivity and specificity
Receiver Operating Characteristic (ROC) curves created by protein and gene expression signature. For each ROC curve, Area Under the Curve (AUC) and the inflection point are shown in each box. A-C are ROC curves for CD8 cell surface protein signatures (A: Signature index = CD39+, PD1+, CD103+, CD4, CD8A, CD45RA, C D62L, CD134, B: Signature index = CD39+, CD103+, C: Signature index = CD39+, CD103+, PD1+) For B and C, p-values as compared with the ROC of A are shown. (D) CD8 transcriptome signature (Signature index = CXCL13+, ENTPD1+, BATF+, GZMB+, CD27+, TIGIT+, PHLDA1+, CD74+, HLA-DMA+, HLA-DRA+, HLA-DRB1+, HLA-DPB1+, CD3D+, CD82+, ARL3+, HMOX1+, ALOX5AP+, DUSP4+, CARS+, LSP1+, CCND2+, TPI1+, GAPDH+, ITM2A+, HMGN3+, CHST12+, NAP1L4+, IL7R, TPT1, RPS12, RPS16, S100A10) (E) CD8 protein and transcriptome joint signature (F) CD4 cell surface protein signature (Signature index = CD39+, PD1+, CD45RA, CD8A, CD137) (G) CD4 transcriptome signature (Signature index = CXCL13+, NR3C1+, ADGRG1+, NMG+, ITM2A+, ETV7+, COTL1+, B2M+, IGFL2+ VIM, MT-ND1, MALAT1, EMP3) (H) CD4 cell surface protein and transcriptome joint signature are shown. See also related Figure S2, S3, S4 and S5.
Figure 7
Figure 7. In depth analysis of neoantigen-reactive CD4+ and CD8+ T cell transcriptome
Analysis on the transcriptome of CD8+ and CD4+ neoantigen-reactive T cells. (A) CD8+ and (B) CD4+ neoantigen-reactive clonotypes identified in the study. Blue lines on the right side of heat maps indicate down-regulated genes, and red lines up-regulated genes. For each patient, the left-most column is gene expression in non-reactive T-cells. Differentially expressed genes were identified by comparing reactive and non-reactive T-cells in each patient, and a gene was deemed significant in CD8+ T cells if it demonstrated a log2 fold change between groups of at least 0.25, expression in at least 10% of the cells for at least one group, and an adjusted p-value of at least 0.05; the expression threshold was set to 0.05 for CD4+ T cells.
Figure 8
Figure 8. Enrichment of CXCL13-expressing cells by FACS-based cell sorting
Dot plots of cell surface proteins that were used for the virtual FACS sort of CXCL13+ cells. Red dots represent all proven neoantigen-reactive T-cells for each patient. CD8 T cells are shown in (A) and CD4 T cells in (B). In (A), each gating line in the plot represents CD39+, CD45RA, PD1+, CD103+ and CD4low (below the median value for all CD8+) and in (B), CD39+, PD1+, and below the median value of total CD4+ T cells for CD45RA, CD8, and CD137. (C) and (E) show the percentage of CXCL13+ cells within the selected cells and (D) and (F) the fold enrichment of CXCL13+ cells through the serial gating. (patient 1: orange line with circles, patient 2: brown line with squares, patient 3: pink line with triangles, patient 4: blue line with inverted triangles)

Comment in

References

    1. Acharya N, Madi A, Zhang H, Klapholz M, Escobar G, Dulberg S, Christian E, Ferreira M, Dixon KO, Fell G, et al. (2020). Endogenous Glucocorticoid Signaling Regulates CD8+ T Cell Differentiation and Development of Dysfunction in the Tumor Microenvironment. Immunity 53, 658–671.e6. - PMC - PubMed
    1. Baixauli F, Martín - Cófreces NB, Morlino G, Carrasco YR, Calabia - Linares C, Veiga E, Serrador JM, and Sánchez - Madrid F (2011). The mitochondrial fission factor dynamin - related protein 1 modulates T - cell receptor signalling at the immune synapse. Embo J 30, 1238–1250. - PMC - PubMed
    1. Blank CU, Haining WN, Held W, Hogan PG, Kallies A, Lugli E, Lynn RC, Philip M, Rao A, Restifo NP, et al. (2019). Defining ‘T cell exhaustion.’ Nat Rev Immunol 19, 665–674. - PMC - PubMed
    1. van der Bruggen P, Traversari C, Chomez P, Lurquin C, Plaen ED, den Eynde BV, Knuth A, and Boon T (1991). A gene encoding an antigen recognized by cytolytic T lymphocytes on a human melanoma. Science 254, 1643–1647. - PubMed
    1. Caushi JX, Zhang J, Ji Z, Vaghasia A, Zhang B, Hsiue EH-C, Mog BJ, Hou W, Justesen S, Blosser R, et al. (2021). Transcriptional programs of neoantigen-specific TIL in anti-PD-1-treated lung cancers. Nature 1–7. - PMC - PubMed

Publication types

MeSH terms

Substances