. 2022 Jun 15;13(6):438-453.e5.
doi: 10.1016/j.cels.2022.03.006. Epub 2022 Apr 21.

Simultaneous brain cell type and lineage determined by scRNA-seq reveals stereotyped cortical development

Affiliations

Simultaneous brain cell type and lineage determined by scRNA-seq reveals stereotyped cortical development

Donovan J Anderson et al. Cell Syst. .

Abstract

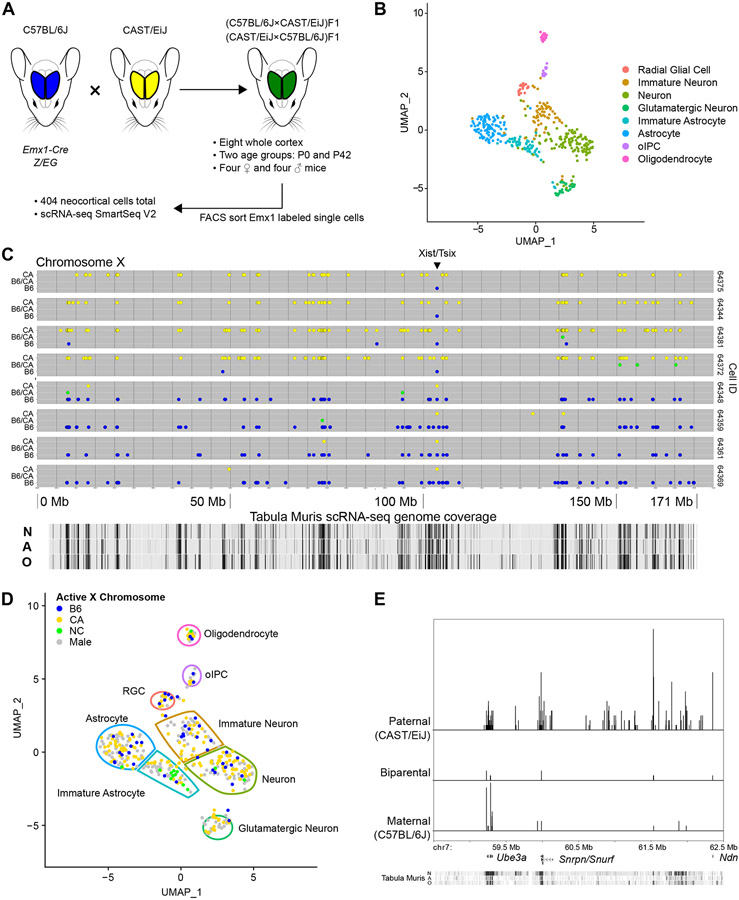
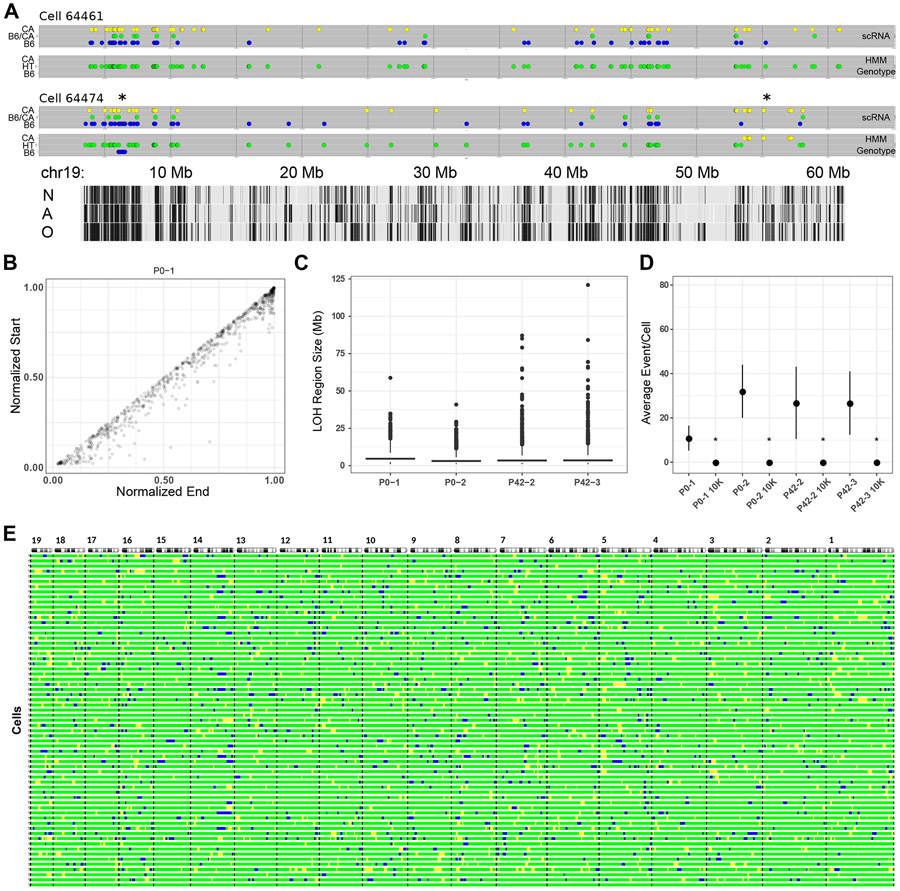
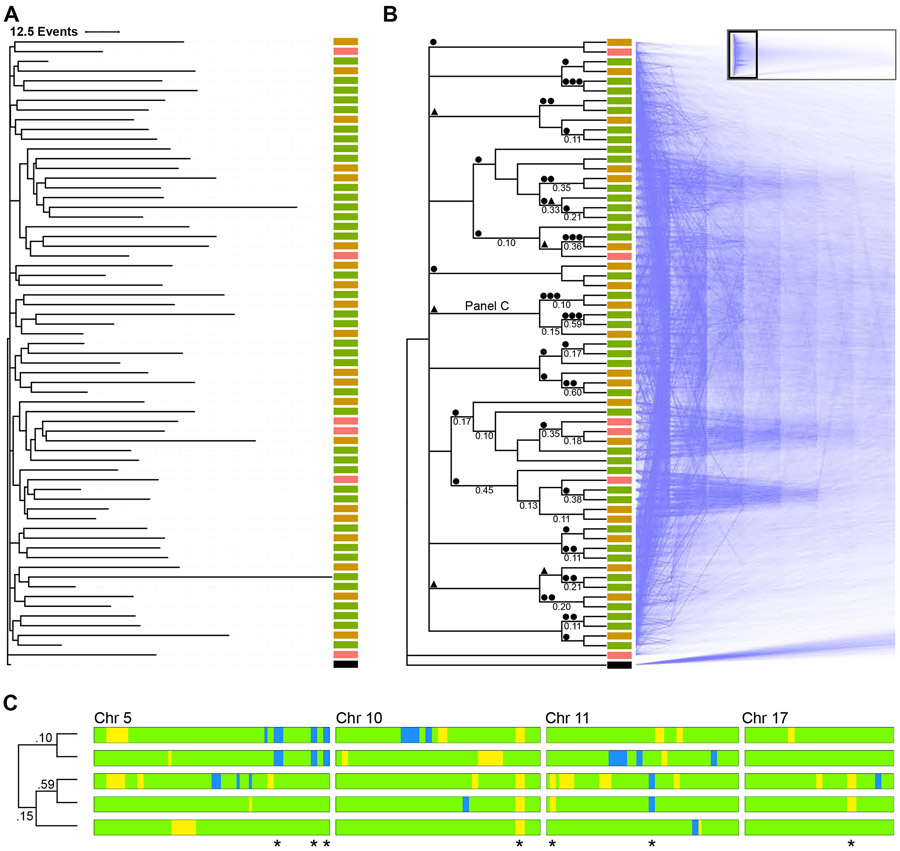
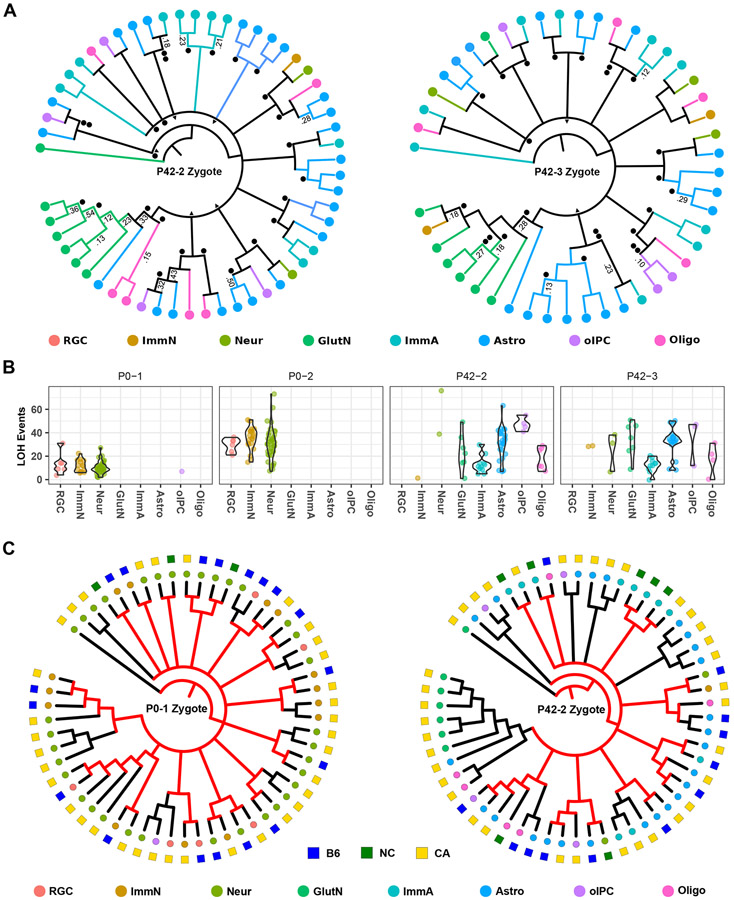
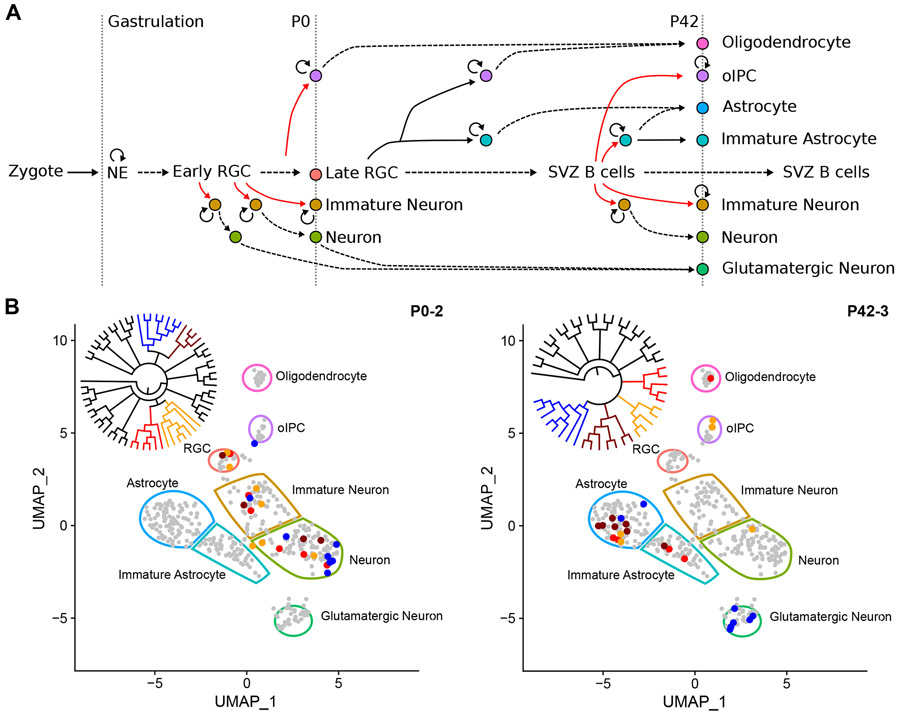
Mutations are acquired frequently, such that each cell's genome inscribes its history of cell divisions. Common genomic alterations involve loss of heterozygosity (LOH). LOH accumulates throughout the genome, offering large encoding capacity for inferring cell lineage. Using only single-cell RNA sequencing (scRNA-seq) of mouse brain cells, we found that LOH events spanning multiple genes are revealed as tracts of monoallelically expressed, constitutionally heterozygous single-nucleotide variants (SNVs). We simultaneously inferred cell lineage and marked developmental time points based on X chromosome inactivation and the total number of LOH events while identifying cell types from gene expression patterns. Our results are consistent with progenitor cells giving rise to multiple cortical cell types through stereotyped expansion and distinct waves of neurogenesis. This type of retrospective analysis could be incorporated into scRNA-seq pipelines and, compared with experimental approaches for determining lineage in model organisms, is applicable where genetic engineering is prohibited, such as humans.

Keywords: LOH; X-inactivation; brain development; cell fate; lineage; loss of heterozygosity.


Conflict of interest statement

Declaration of interests The authors declare no competing interests.

Figures

Figure 1.
Figure 1.. Isolation and transcriptome sequencing of mouse neocortical cells
(A) B6 (blue) and CA (yellow) mice were crossed in both directions to create heterozygous F1 offspring (green). Single Emx1 expression-marked neocortical cells were isolated from two different ages and their transcriptomes sequenced. (B) 404 cells, shown in dimensionally reduced (UMAP) space, were clustered based on gene expression and eight cell types identified. oIPC = oligodendrocytic intermediate progenitor cell. (C) Representative allele plots of heterozygous X-chromosome SNVs in eight cells (rows) from a female P0 mouse, showing X-inactivation. Note the reciprocal allele state detected at the Xist/Tsix locus. Allele state: blue = B6, green = B6/CA, yellow = CA. N = neuron, A = astrocyte, O = oligodendrocyte. (D) Active X-chromosome for female cells shown in dimensionally reduced space. NC = biparental/not called. (E) Imprinting associated with the Prader-Willi/Angelman syndrome locus. Relative density histogram ridgeline plots (1 bp bins) of cells expressing maternal, paternal, or biparental variants at particular SNV locations from one mouse (P0-2, 64 cells). Chromosome coordinates, discussed genes, and Tabula Muris scRNA-seq coverage track (as in C) are shown on the x-axis. Relative density for each allele category is indicated on the y-axis. UMAP visualizations and scRNA-seq based alleles are derived from Seurat_CountMatrix and VCFs Supplemental Data sets.
Figure 2.
Figure 2.. Inferring LOH from scRNA-seq
(A) HMM results showing two mouse cells with either no LOH event (cell 64461) or two events (cell 64474, marked with *) along chromosome 19. Detected loci are shown as in Figure 1C, with the vertical axis indicating expressed allele state (scRNA) or HMM-inferred genotype (HMM Genotype). Tabula Muris cell-type specific transcription tracks are shown at the bottom, N = neuron, A = astrocyte, O = oligodendrocyte. (B) Length-normalized chromosome positions of all LOH events from all autosomes of one mouse. (C) Distribution of LOH lengths (≥1 Mb) for all mice showing median (bar) and IQR (box). (D) Violin plots of average LOH events per cell for each mouse (n = 56 (P0-1), 64 (P0-2), 56 (P42-2), 47 (P42-3)) and 10,000 randomly sampled in silico cells from the respective mouse. Mean and standard deviation are indicated for each by a black circle and vertical lines. *p-value <10−5 (two sample Z-test, mouse vs. 10K sampled cells). (E) Autosomal barcode of 56 cells plus a virtual zygote (bottom bar) derived from one mouse (P0-2). Autosomes are shown at the top with the centromeres on the left. Black bars indicate autosomal boundaries. For all panels, blue = B6, green = B6/CA, yellow = CA. Supplemental Data: HMM_Genotype_Tables
Figure 3.
Figure 3.. Phylogenetic analysis using LOH events
(A) Lineage of 56 cortical cells plus a virtual zygote from a P0 mouse was inferred using a Camin-Sokal parsimony-inspired Bayes model. Consensus phylogram shows the relatedness and number of LOH events for each cell. Scale bar = 12.5 events. ■ RGC, ■ immature neuron, ■ neuron, ■ zygote. (B) The same lineage in cladogram form with supporting nodal posterior probabilities ≥0.1 indicated, with mirrored “densiTree” representation of 1,500 sampled cladograms. The complete densiTree representation is shown as an inset with magnified area indicated. ● LOH event shared among all daughter cells, ▲ LOH event shared in all but one daughter cell. (C) Barcode of segregating alleles (*) from a monophyletic clade marked “Panel C” in panel above. Chromosomes are aligned with the centromere to the left. Blue and yellow regions indicate LOH events (B6 and CA, respectively). Green regions indicate heterozygosity. Node posterior probability shown on the cladogram.
Figure 4.
Figure 4.. Stereotyped expansion in the mouse neocortex
(A) Consensus cladograms of two P42 mice. Nodes with posterior probability of >0.05 are resolved. Posterior probabilities of >0.10 are indicated. ● LOH event shared among all daughter cells, ▲ LOH event shared in all but one daughter cell. (B) LOH events by mouse and cell type. Total autosomal LOH events are shown for each cell on the y-axis. Violin plots show event distribution for each cell type in each mouse. (C) The active X-chromosome is overlaid onto cell lineages of two female mice. The active X-chromosome (square) and cell type (circle) is indicated by color. NC = biparental/not called. For clades composed of either active X-chromosome, the most recent common cell (internal nodes) are inferred to occur about or before the time of gastrulation (when X-inactivation takes place) and their respective preceding branches are colored red. Nodes predicted to occur after the approximate time of gastrulation are shown in black. RGC = radial glia cell, ImmN = immature neuron, Neur = neuron, GlutN = glutamatergic neuron, ImmA = immature astrocyte, Astro = astrocyte, oIPC = oligodendrocyte intermediate progenitor cell, Oligo = oligodendrocyte.
Figure 5.
Figure 5.. Lineage across cell types and developmental time
(A) Expansion and differentiation of Emx1+ neural stem cells (NSC) into neurons and glia, as adapted (Kriegstein and Alvarez-Buylla, 2009). Neuroendothelial (NE) cells expand (circular arrow) to form a pool of radial glial cells (RGC) that produce neurons and glia in the cortex via asymmetric cell division (red lines), expansion, and maturation (dashed lines). Time-dependent development proceeds horizontally. Observed cells in this study are indicated by vertical dotted lines along with their relative time points. oIPC = oligodendrocyte intermediate progenitor cell, SVZ = subventricular zone. (B) Example of different clades encompassing multiple cell types. All 404 cells are shown in reduced dimensional (UMAP) space to illustrate all possible cell types, indicated by color-bound regions. Cells from four representative clades of a P0 and P42 mouse (inset cladograms) are indicated by their corresponding colors. UMAP visualizations are derived from the Seurat_CountMatrix Supplemental Data set.

Similar articles

Cited by

References

    1. Anda F.C. de, Madabhushi R, Rei D, Meng J, Gräff J, Durak O, Meletis K, Richter M, Schwanke B, Mungenast A, et al. (2016). Cortical neurons gradually attain a post-mitotic state. Cell Res. 26, 1033–1047. - PMC - PubMed
    1. Andergassen D, Dotter CP, Wenzel D, Sigl V, Bammer PC, Muckenhuber M, Mayer D, Kulinski TM, Theussl H-C, Penninger JM, et al. (2017). Mapping the mouse Allelome reveals tissue-specific regulation of allelic expression. Elife 6, e25125. - PMC - PubMed
    1. Auwera GA, Carneiro MO, Hartl C, Poplin R, del Angel G, Levy-Moonshine A, Jordan T, Shakir K, Roazen D, Thibault J, et al. (2013). From FastQ Data to High-Confidence Variant Calls: The Genome Analysis Toolkit Best Practices Pipeline. Current Protocols in Bioinformatics 43, 11.10.1–11.10.33. - PMC - PubMed
    1. Behjati S, Huch M, van Boxtel R, Karthaus W, Wedge DC, Tamuri AU, Martincorena I, Petljak M, Alexandrov LB, Gundem G, et al. (2014). Genome sequencing of normal cells reveals developmental lineages and mutational processes. Nature 513, 422–425. - PMC - PubMed
    1. Berletch JB, Ma W, Yang F, Shendure J, Noble WS, Disteche CM, and Deng X (2015). Escape from X inactivation varies in mouse tissues. PLoS Genet. 11, e1005079. - PMC - PubMed

Publication types

LinkOut - more resources