. 2022 Jun 15;110(12):2024-2040.e10.
doi: 10.1016/j.neuron.2022.03.032. Epub 2022 Apr 21.

General anesthesia globally synchronizes activity selectively in layer 5 cortical pyramidal neurons

Affiliations

General anesthesia globally synchronizes activity selectively in layer 5 cortical pyramidal neurons

Arjun Bharioke et al. Neuron. .

Abstract

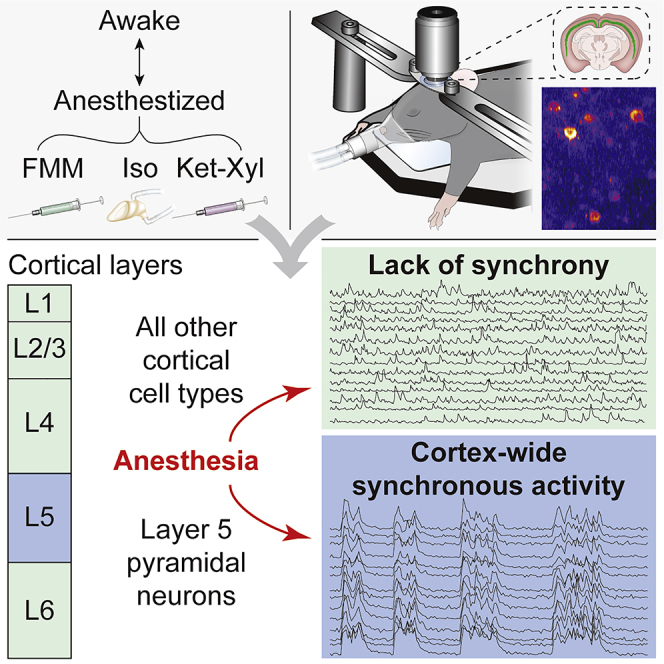
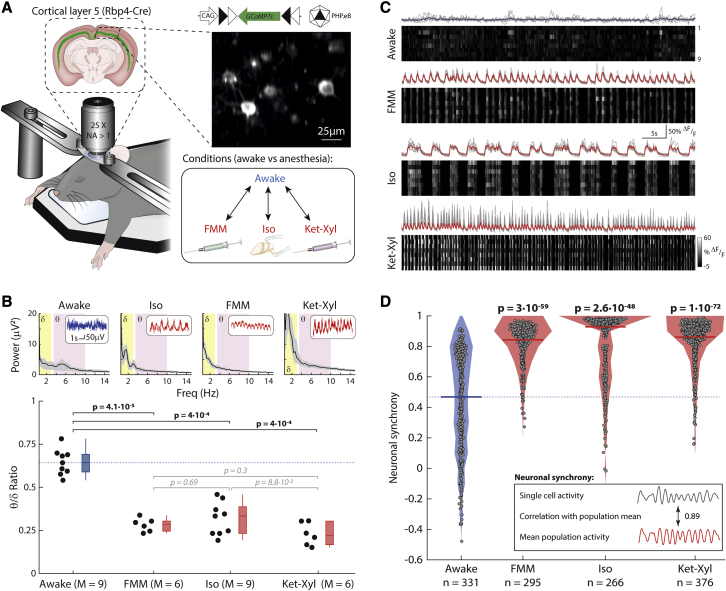
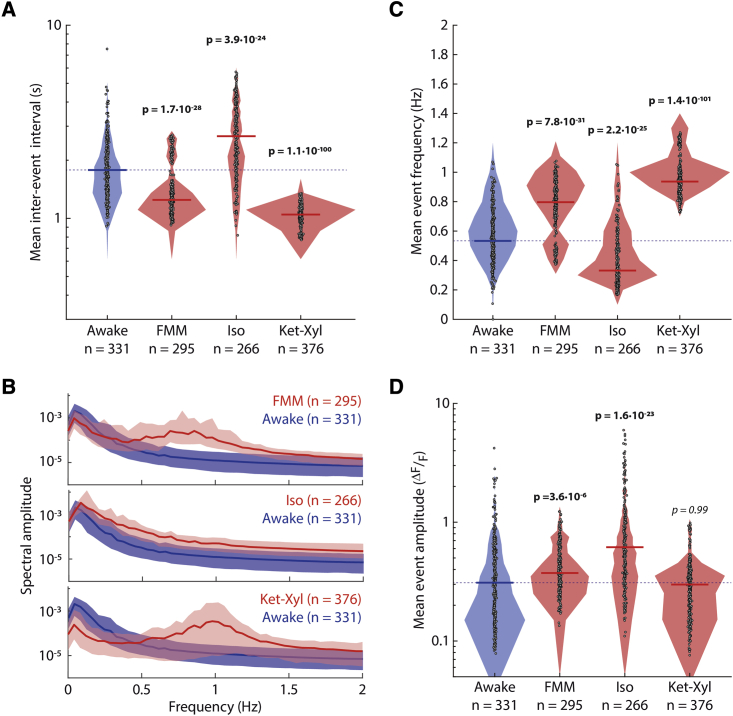
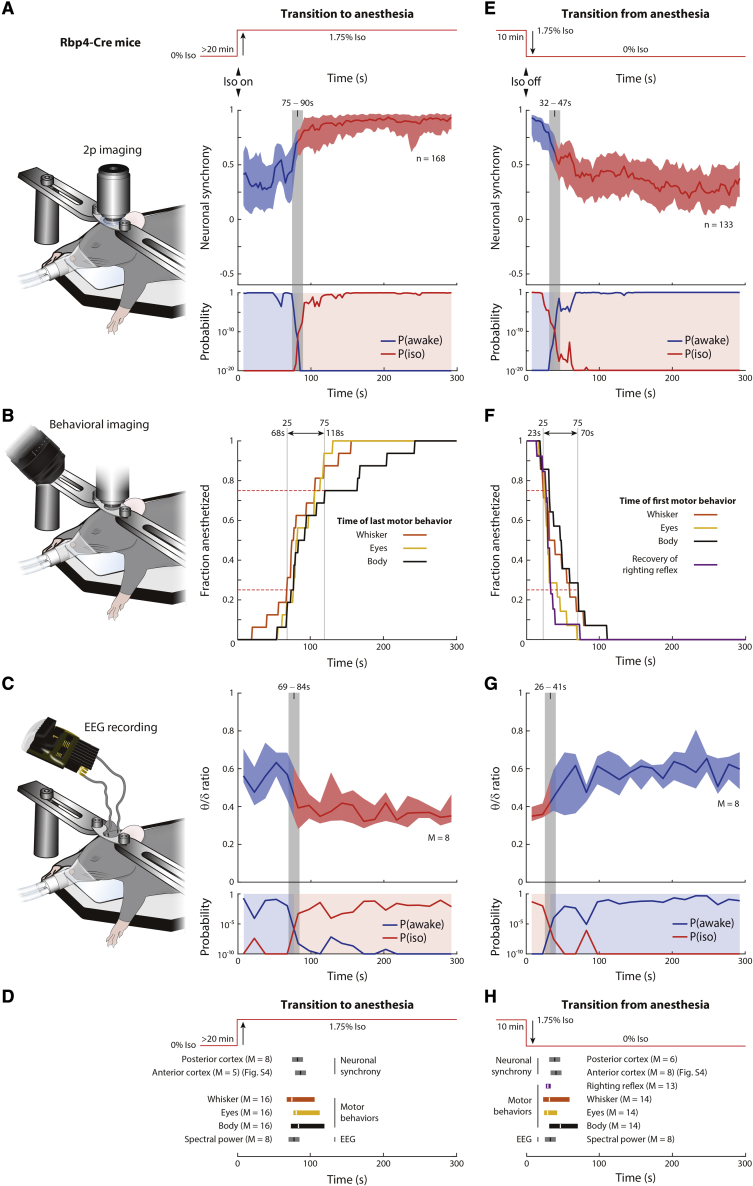
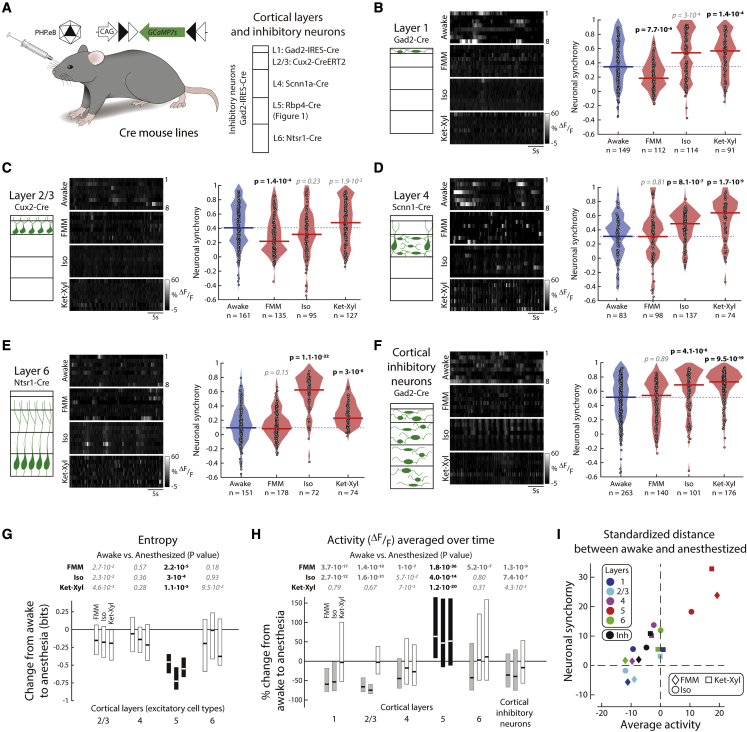
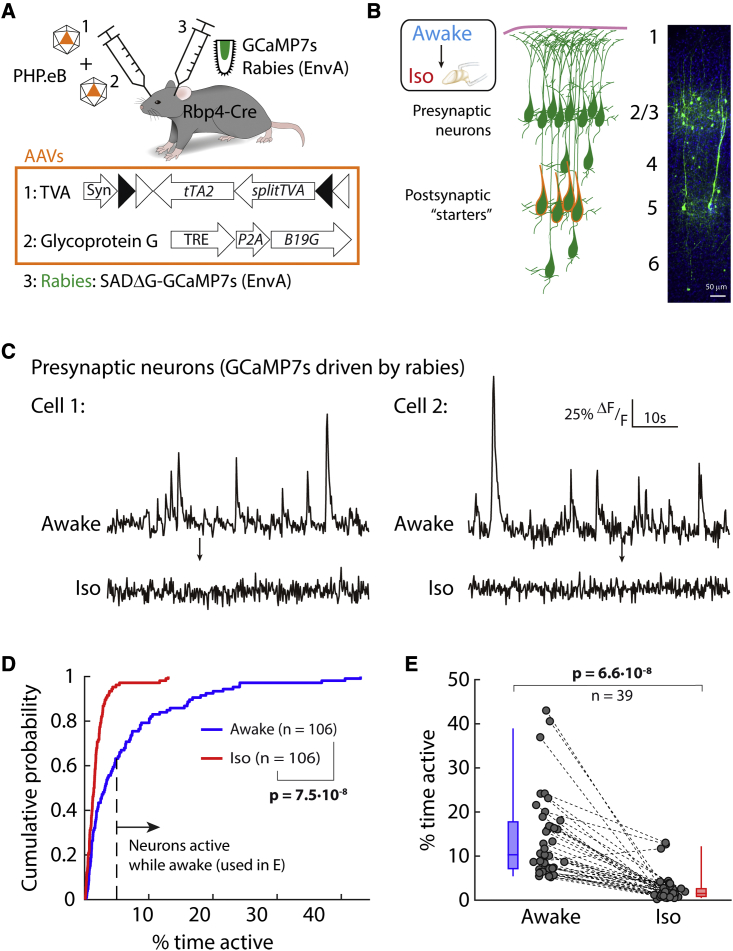
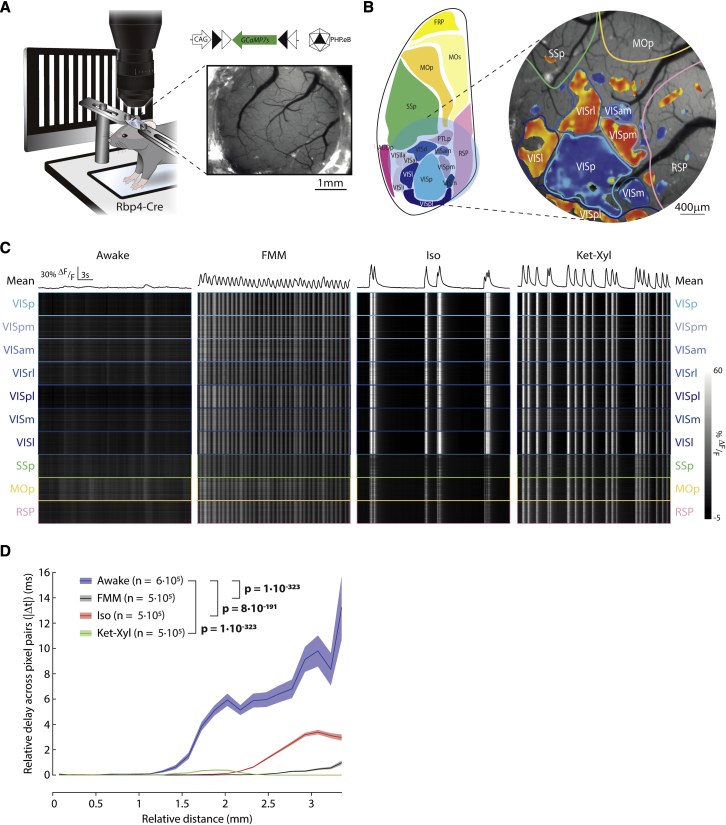
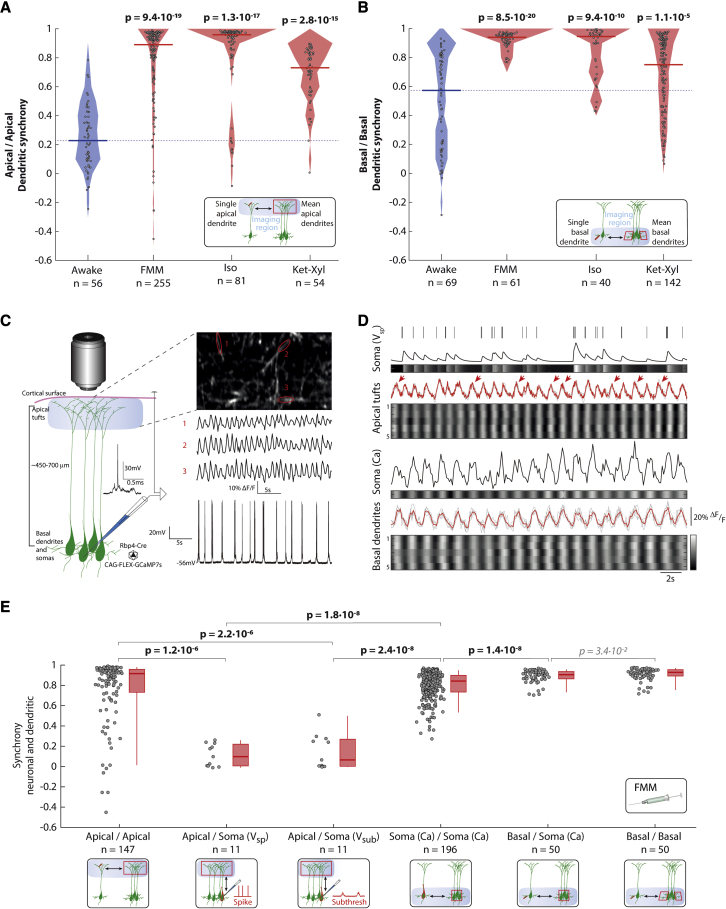
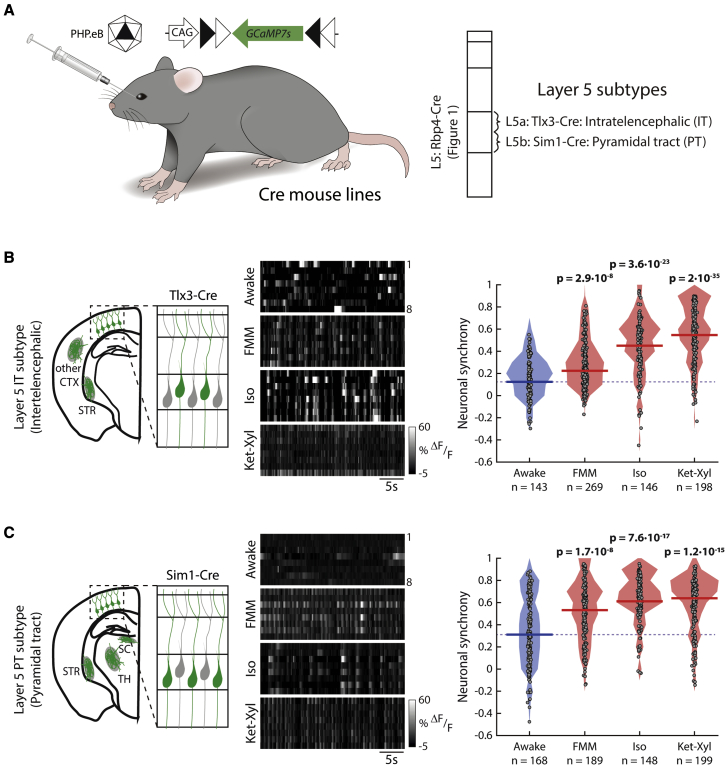
General anesthetics induce loss of consciousness, a global change in behavior. However, a corresponding global change in activity in the context of defined cortical cell types has not been identified. Here, we show that spontaneous activity of mouse layer 5 pyramidal neurons, but of no other cortical cell type, becomes consistently synchronized in vivo by different general anesthetics. This heightened neuronal synchrony is aperiodic, present across large distances, and absent in cortical neurons presynaptic to layer 5 pyramidal neurons. During the transition to and from anesthesia, changes in synchrony in layer 5 coincide with the loss and recovery of consciousness. Activity within both apical and basal dendrites is synchronous, but only basal dendrites' activity is temporally locked to somatic activity. Given that layer 5 is a major cortical output, our results suggest that brain-wide synchrony in layer 5 pyramidal neurons may contribute to the loss of consciousness during general anesthesia.

Keywords: GCaMP7; LOC; ROC; Rbp4-Cre mouse; consciousness; cortex; cortical output; electrophysiology; general anesthesia; layer 5; loss and recovery of consciousness; neuronal activity; pyramidal cells; synchrony; two-photon imaging.


Conflict of interest statement

Declaration of interests The authors declare no competing interests.

Figures

None
Graphical abstract
Figure 1
Figure 1
Synchronous activity in L5 cortical neurons during anesthesia (A) Rbp4-Cre mice, injected with PHP.eB AAV-CAG-FLEX-GCaMP7s, imaged in darkness. (B) Upper: EEG power spectrum. Inset: example traces. Lower: θ-δ EEG ratio across mice. Box: 25 percentile–75 percentile; whisker: 5 percentile–95 percentile; line: median; blue: awake; red: anesthetized; dashed line: awake median. Wilcoxon rank-sum (p < 0.003, prior to Bonferroni correction for 6 comparisons) (bold: significant; italic: not significant). (C) Calcium activity of example neurons (upper: gray lines; lower: grayscale). Mean: blue (awake), red (anesthetized). See Video S1. (D) Filled circles: neuronal synchrony per cell; solid line: median; shading: distribution; dashed line: awake median. Wilcoxon rank-sum (p < 0.003, prior to Bonferroni correction for 3 comparisons). See Figures S1 and S3. (B) M = mice. (C and D) n = cells from 9 (awake) and 8 (each anesthetic) mice. See Figure S6.
Figure 2
Figure 2
Mean inter-event interval, frequency, and mean event amplitude in L5 neurons (A) Filled circles: mean of inter-event intervals per neuron; solid line: median; shading: distribution; dashed line: awake median. (B) Amplitude of frequency spectrum. Line: median across neurons; shading: 25 percentile–75 percentile. (C) Filled circles: mean event frequency per neuron. See Figure S2. (D) Filled circles: mean event amplitude per neuron. (A, C, and D) Lines and shading as in (A). Wilcoxon rank-sum (p < 0.003, prior to Bonferroni correction for 3 comparisons) (bold: significant; italic: not significant). (A–D) n = cells from 9 (awake) and 8 (each anesthetic) mice.
Figure 3
Figure 3
Changes in neuronal synchrony coincide with the loss and recovery of consciousness (A–H) Transition to (A–D) and from (E–H) anesthesia in Rbp4-Cre mice, injected with PHP.eB AAV-CAG-FLEX-GCaMP7s. (A and E) Neuronal synchrony in posterior cortex. Upper: anesthesia protocol. Middle: neuronal synchrony in 15 s-rolling window. Lower: probability that neuronal synchrony in each window is sampled from awake (P(awake): awake-probability curve; blue line) or Iso (P(iso): anesthetized-probability curve; red line) distributions from Figure 1D. Blue shading when blue line is higher than red line; red shading when red line is higher than blue line (also applied to middle). Gray bar: crossing of P(awake) and P(iso). n = cells in 8 mice (A) and 6 mice (E). See Figure S4. (B and F) Behavioral imaging with infrared camera. Fraction of mice remaining at each time point following induction (B) or termination (E) of Iso, as assessed by motor behaviors. Dashed lines: 25 and 75 percentiles (time marked by gray lines). Arrow marks time when 25%–75% of mice terminated (B) or initiated (F) movements. See Figure S5. (C and G) Upper: θ-δ ratio after induction (C) or termination (G) of Iso, in 15-s windows. Lower: probability that θ-δ ratio in each window is sampled from awake (P(awake): awake-probability curve; blue line) or Iso (P(iso): anesthetized-probability curve; red line) distributions from Figure 1B. Shading color and gray bar as in (A) and (E). (D and H) Transition times of neuronal synchrony for posterior and anterior cortex (A, E, and Figure S4), motor behaviors (B) and (F) and EEG spectral power (C) and (G). (A, E, C, and G) Line: median; shading: 25 percentile–75 percentile. (C, D, G, and H) M = mice.
Figure 4
Figure 4
Neurons in cortical layers 1, 2/3, 4, and 6 and cortical inhibitory neurons do not show higher neuronal synchrony across all anesthetics (A) Mice injected with PHP.eB AAV-CAG-FLEX-GCaMP7s were imaged in darkness. (B–F) Left: schematic. Middle: example activity (grayscale). Right: filled circles: neuronal synchrony for each cell; solid line: median; shading: distribution; dashed line: awake median. Wilcoxon rank-sum (p < 0.003, prior to Bonferroni correction for 18 comparisons, to include L5). See Figure S7. (B) L1: Gad2-Cre. (C) L2/3: Cux2-Cre. (D) L4: Scnn1-Cre. (E) L6: Ntsr-Cre. (F) Cortical inhibitory neurons: Gad2-Cre. (G) Change in mean population entropy, per unit time (L5: Figure 1D). Line: median; box: 25 percentile–75 percentile; black: significant change. See Figure S9. Wilcoxon rank-sum (p < 0.05, prior to Bonferroni correction for 12 comparisons) (bold: significant; italic: not significant). (H) Change in average spontaneous activity per neuron (L5: Figure 1D). Line: median; box: 25 percentile–75 percentile; black: significant increase; gray: significant decrease. See Figure S10. Wilcoxon rank-sum (p < 0.003, prior to Bonferroni correction for 18 comparisons) (bold: significant; italic: not significant). (I) Standardized distances of neuronal synchrony and average spontaneous activity between each anesthetic and awake. Standardized distances, measured from Monte Carlo samples from the combined distribution of each anesthetized condition and awake, are standard deviations above the mean (Z score). See Figure S8. (B–F) n = neurons from L1: 6 mice; L2/3: 6 mice; L4: 6 mice; L6: 5 mice (awake) and 4 mice (each anesthetic); cortical inhibitory neurons: 5 mice. See Figure S6.
Figure 5
Figure 5
Cortical neurons presynaptic to L5 are silent during anesthesia (A) Rbp4-Cre mice were infected with rabies encoding GCaMP7s through a dual AAV strategy. (B) Schematic (left) and immunostaining (right) of GCaMP7s in L5 neurons (starters) and their presynaptic neurons within cortex. (C) Activity of two example presynaptic neurons before and after Iso anesthesia. (D) Cumulative probability of activity in presynaptic neurons between awake (blue) and Iso (red). Kolmogorov-Smirnov (p < 0.003). (E) Change in neuronal activity (dashed lines) from awake (blue) to Iso anesthesia (red) for each neuron active >5% of time while awake (from D). Box: 25 percentile–75 percentile; whisker: 5 percentile–95 percentile; line: median. Wilcoxon signed rank (p < 0.003). (D and E) n = neurons in 5 mice.
Figure 6
Figure 6
Synchronized activity in L5 extends across cortical areas and distances (A) Epifluorescence imaging of Rbp4-Cre mice, injected with PHP.eB AAV-CAG-FLEX-GCaMP7s. Inset: cranial window. Visual stimulation to identify visual cortices. Spontaneous activity recorded in darkness. (B) Left: schematic cranial window location (blue circle). Right: imaging window with visual field sign map marking visual areas (VISp: primary; VISpm: posteromedial; VISam: anteromedial; VISrl: rostrolateral; VISpl: posterolateral; VISm: medial; VISl: lateral) and estimated locations of other cortices (SSp, primary somatosensory; MOp, primary motor; RSP, retrosplenial). (C) Spontaneous activity in darkness. Upper: mean across pixels. Lower: activity of 100 pixels within each area (grayscale). See Figure S11. (D) Median relative delay between pixels pairs plotted against their relative distance. Shading: bootstrapped confidence interval. Wilcoxon rank-sum; n = pixel pairs from 6 mice.
Figure 7
Figure 7
Dendritic synchrony matches neuronal synchrony in basal but not apical dendrites (A and B) Rbp4-Cre mice injected with PHP.eB AAV-CAG-FLEX-GCaMP7s imaged in darkness. Filled circles: apical tuft (A) and basal dendrite (B) dendritic synchrony; solid line: median; shading: distribution; dashed line: awake median. n = regions of interest (ROIs) from 9 (awake), 8 (each anesthetic) mice. (C) Simultaneous patch-clamp and imaging. Left: schematic with example (see Figure S12). Right, top: calcium activity from 3 ROIs. Right, bottom: voltage recording. (D) Simultaneous soma and dendritic recordings. Upper: apical tuft. Lower: basal dendrites. Soma (Vsp): somatic spiking and predicted calcium trace (by convolution) (line and grayscale). Apical tufts: ROIs’ activity (gray lines, grayscale) with mean (red). Arrows: unaligned calcium events. Soma (Ca): soma activity (line, grayscale). Basal dendrites: ROIs’ activity (gray lines, grayscale) with mean (red). Grayscale activity individually scaled from min (black) to max (white). (E) Synchrony under FMM (red line: median; box: 25 percentile–75 percentile; whisker 5 percentile–95 percentile). See Figure S13; Soma: Vsp: predicted calcium trace (by convolution); Vsub: subthreshold membrane voltage; Ca: calcium imaging (Figure 1D); n = ROIs (calcium imaging) or recordings (patch clamp and juxtacellular). Imaging of somas in 9 (awake) and 8 (each anesthetic) mice; dendrites in 5 mice; electrophysiology from 5 neurons in 3 mice. (A, B, and E) Wilcoxon rank-sum (p < 0.003, prior to Bonferroni correction for 6 comparisons) (bold: significant; italic: not significant).
Figure 8
Figure 8
Output subtypes of L5 PNs show increased neuronal synchrony (A) Mice, injected with PHP.eB AAV-CAG-FLEX-GCaMP7s, were imaged in darkness. See Figure S14. (B and C) Left: schematic neurons and projections patterns (green) (CTX, cortex; STR, striatum; SC, superior colliculus; TH, thalamus). Middle: example activity (grayscale). Right: filled circles: neuronal synchrony of each neuron; solid line: median; shading: distribution; dashed line: awake median. Wilcoxon rank-sum (p < 0.003, prior to Bonferroni correction for 9 comparisons, to include Rbp4-Cre) (bold: significant). See Figure S15. n = neurons in 6 Tlx3-Cre (B), 5 Sim1-Cre (C) mice.

Comment in

References

    1. Aasebø I.E.J., Lepperød M.E., Stavrinou M., Nøkkevangen S., Einevoll G., Hafting T., Fyhn M. Temporal processing in the visual cortex of the awake and anesthetized rat. eNeuro. 2017;4:1–26. - PMC - PubMed
    1. Adams S., Pacharinsak C. Mouse anesthesia and analgesia. Curr. Protoc. Mouse Biol. 2015;5:51–63. - PubMed
    1. Akeju O., Loggia M.L., Catana C., Pavone K.J., Vazquez R., Rhee J., Contreras Ramirez V., Chonde D.B., Izquierdo-Garcia D., Arabasz G., et al. Disruption of thalamic functional connectivity is a neural correlate of dexmedetomidine-induced unconsciousness. Elife. 2014;3:e04499. - PMC - PubMed
    1. Akeju O., Westover M.B., Pavone K.J., Sampson A.L., Hartnack K.E., Brown E.N., Purdon P.L. Effects of sevoflurane and propofol on frontal electroencephalogram power and coherence. Anesthesiology. 2014;121:990–998. - PMC - PubMed
    1. Akrawi W.P., Drummond J.C., Kalkman C.J., Patel P.M. A comparison of the electrophysiologic characteristics of EEG burst-suppression as produced by isoflurane, thiopental, etomidate, and propofol. J. Neurosurg. Anesthesiol. 1996;8:40–46. - PubMed

Publication types

Substances