. 2022 Jun;298(6):101963.
doi: 10.1016/j.jbc.2022.101963. Epub 2022 Apr 20.

αα-hub coregulator structure and flexibility determine transcription factor binding and selection in regulatory interactomes

Affiliations

αα-hub coregulator structure and flexibility determine transcription factor binding and selection in regulatory interactomes

Frederik Friis Theisen et al. J Biol Chem. 2022 Jun.

Abstract

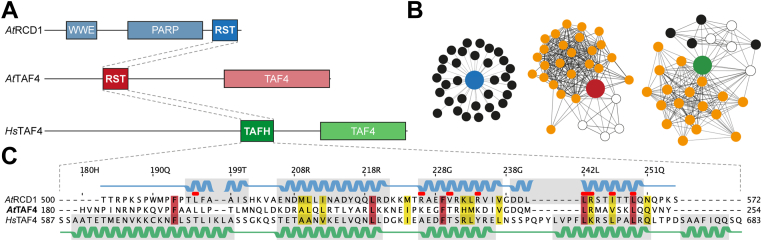
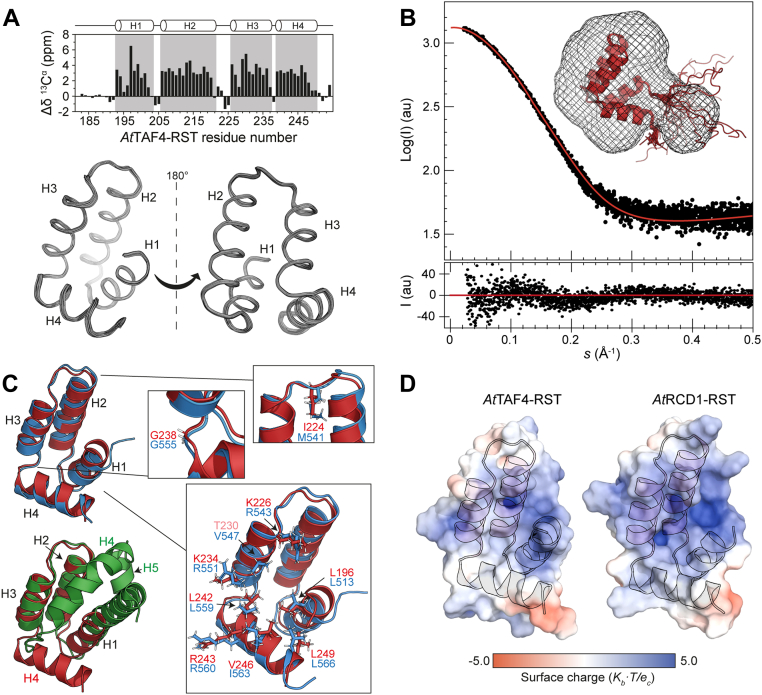
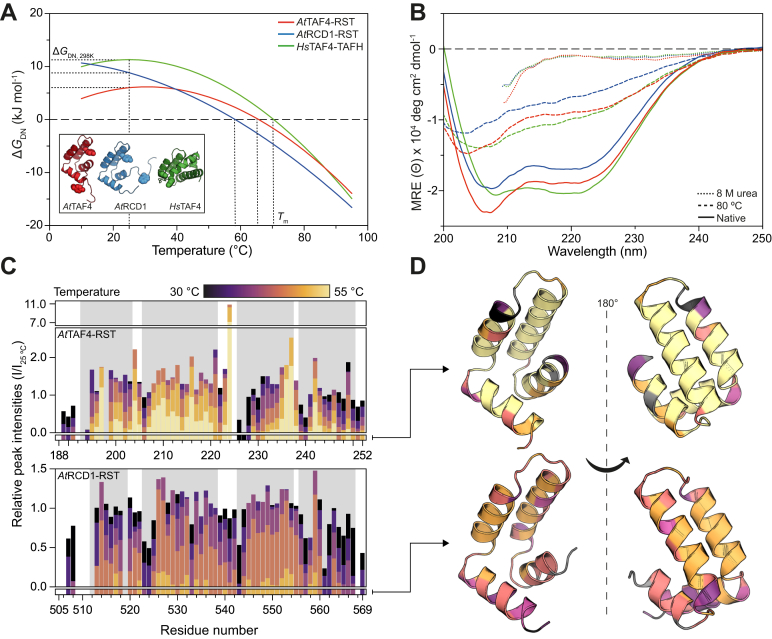
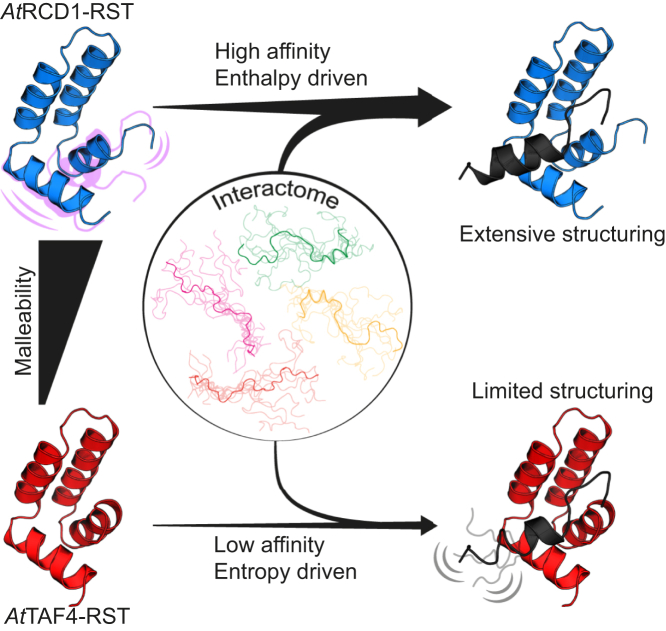
Formation of transcription factor (TF)-coregulator complexes is a key step in transcriptional regulation, with coregulators having essential functions as hub nodes in molecular networks. How specificity and selectivity are maintained in these nodes remain open questions. In this work, we addressed specificity in transcriptional networks using complexes formed between TFs and αα-hubs, which are defined by a common αα-hairpin secondary structure motif, as a model. Using NMR spectroscopy and binding thermodynamics, we analyzed the structure, dynamics, stability, and ligand-binding properties of the Arabidopsis thaliana RST domains from TAF4 and known binding partner RCD1, and the TAFH domain from human TAF4, allowing comparison across species, functions, and architectural contexts. While these αα-hubs shared the αα-hairpin motif, they differed in length and orientation of accessory helices as well as in their thermodynamic profiles of ligand binding. Whereas biologically relevant RCD1-ligand pairs displayed high affinity driven by enthalpy, TAF4-ligand interactions were entropy driven and exhibited less binding-induced structuring. We in addition identified a thermal unfolding state with a structured core for all three domains, although the temperature sensitivity differed. Thermal stability studies suggested that initial unfolding of the RCD1-RST domain localized around helix 1, lending this region structural malleability, while effects in TAF4-RST were more stochastic, suggesting variability in structural adaptability upon binding. Collectively, our results support a model in which hub structure, flexibility, and binding thermodynamics contribute to αα-hub-TF binding specificity, a finding of general relevance to the understanding of coregulator-ligand interactions and interactome sizes.

Keywords: alternative state; entropy; interactome size; intrinsically disordered protein; malleability; protein dynamic; protein structure; protein–protein interaction; transcriptional coactivator; αα-hub specificity.


Conflict of interest statement

Conflict of interest The authors declare that they have no conflicts of interest with the contents of this article.

Figures

Figure 1
Figure 1
Domain architectures, interactomes, and sequence alignments of AtTAF4, AtRCD1, and HsTAF4.A, schematic domain organization of AtRCD1 (Q8RY59), AtTAF4 (AT5G43130), and HsTAF4 (O00268). B, interactomes of AtRCD1, AtTAF4, and HsTAF4 obtained from the IntAct Molecular Interaction Database (60). The central αα-hub containing proteins are color coded as in A. Black interaction partners are TFs, TFIID components are orange, and other types of proteins are shown as white circles. C, sequence alignment of the AtTAF4–RST, AtRCD1–RST, and HsTAF4–TAFH αα-hub domains. Conserved residues are shown in red, and positions with conservative substitutions are shown in yellow. The secondary structure elements of AtRCD1–RST (Protein Data Bank code: 5OAO) and HsTAF4–TAFH (Protein Data Bank code: 2P6V) are shown above and below the alignment, respectively. Red dots highlight key residues for interactions between AtRCD1–RST and DREB2A TFs (14). Residue numbering is from AtTAF4. AtRCD1, Arabidopsis thaliana radical-induced cell death1; AtTAF4, Arabidopsis thaliana transcription initiation factor TFIID-subunit 4; DREB2A, dehydration-responsive element–binding protein 2A; HsTAF4, Homo sapiens transcription initiation factor TFIID-subunit 4; TF, transcription factor.
Figure 2
Figure 2
Structure and SAXS analysis of AtTAF4–RST.A, top, secondary Cα chemical shifts per residue for AtTAF4–RST. Top schematic shows helix boundaries. Bottom, 20 lowest energy structures of AtTAF4–RST aligned by Cα atoms of well-defined region (residues 193–250). B, fit of the experimental SAXS curve (4.2 mg/l) (black) on the back-calculated SAXS curve obtained from the NMR ensemble (red line) using CRYSOL. Inset, docking of the NMR structure of AtTAF4–RST in the ab initio averaged bead model envelope. C, structure alignments of AtTAF4–RST (red) with AtRCD1–RST (blue) and HsTAF4–TAFH (green). Insets, residues of AtTAF4–RST (red) and the corresponding residues in AtRCD1–RST (blue) of importance for DREB2A interaction (14), for forming the β3-position, and the tight angle between H3 and H4 is shown as sticks. D, surface electrostatics of AtTAF4–RST and AtRCD1–RST calculated using PyMOL APBS (74). AtTAF4, Arabidopsis thaliana transcription initiation factor TFIID-subunit 4; DREB2A, dehydration-responsive element–binding protein 2A; RST, RCD1, SRO, and TAF4; SAXS, small-angle X-ray scattering; TAFH, TATA-box–associated factor homology.
Figure 3
Figure 3
Stability of αα-hub domains.A, stability curves of AtTAF4–RST (red), AtRCD1–RST (blue), and HsTAF4–TAFH (green) calculated from two-dimensional global analysis according to Equation 6. Inset, position of intrinsic fluorophores (tyrosine and tryptophan) used to monitor unfolding. B, CD spectra of 1 mg ml−1AtRCD1–RST (blue), AtTAF4–RST (red), and HsTAF4–TAFH (green) acquired in 20 mM sodium phosphate, pH 7.4, at 20 °C (solid line), 80 °C (dashed line), and in buffer containing 8 M urea (dotted line) at 20 °C. The data recorded in the presence of urea were excluded below 205 nm because of HT >600 V. C, relative peak intensities in 15N,H HSQC spectra of AtTAF4–RST (top) and AtRCD1–RST (bottom) at increasing temperatures from 30 to 55 °C, with the intensity at 25 °C as reference. The bars below the column graphs indicate the highest temperature for which a peak could be identified. D, residues colored according to highest temperature for which a peak could be assigned (from C) mapped to the structure of AtTAF4–RST (top) and AtRCD1–RST (bottom). Gray colors are unassigned residues. AtRCD1, Arabidopsis thaliana radical-induced cell death1; AtTAF4, Arabidopsis thaliana transcription initiation factor TFIID-subunit 4; HSQC, heteronuclear single quantum coherence; HsTAF4, Homo sapiens transcription initiation factor TFIID-subunit 4; RST, RCD1, SRO, and TAF4; TAFH, TATA-box–associated factor homology.
Figure 4
Figure 4
Transcription factor binding to αα-hub domains.A, ITC data showing the titration of AtTAF4–RST into DREB2A243–272 (left), HsTAF4–TAFH into DREB2A243–272 (middle), and AtTAF4–RST into ANAC013 (right). Experiments were performed at 30 °C. For each experiment, the upper panel shows baseline-corrected raw data from the titration, and the lower panel shows the integrated peaks and the fitted binding curve. B, thermodynamic parameters of the interaction of three αα-hubs with AtDREB2A (dark) and AtANAC013 (light) derived from ITC experiments shown in A and for Fig. S5 and from experiments shown in Refs. (27, 28). C, AtTAF4–RST 15N,HN CSPs (gray bars) induced upon binding of AtDREB2A243–272 shown along with AtRCD1–RST (hollow bars, data from Ref. (39)) using TAF4–RST residue numbering. D, AtDREB2A 15N,HN CSPs for binding AtTAF4–RST (gray bars) (Fig. S6) and AtRCD1–RST (hollow bars, data from Ref. (39)). The sequence of AtDREB2A is shown at the top. F259 could not be assigned in the bound state of AtTAF4–RST. E, 13C secondary chemical shifts in the free state (orange) and in AtTAF4–RST (gray bars) and AtRCD1–RST (hollow bars) bound states. For the AtTAF4–RST, M258 could not be assigned, and only 13Cα was visible for F259. ANAC, A. thaliana NAM, ATAF1/2, and CUC2; AtTAF4, Arabidopsis thaliana transcription initiation factor TFIID-subunit 4; CSP, chemical shift perturbation; DREB2A, dehydration-responsive element–binding protein 2A; HsTAF4, Homo sapiens transcription initiation factor TFIID-subunit 4; ITC, isothermal titration calorimetry; RST, RCD1, SRO, and TAF4; TAFH, TATA-box–associated factor homology.
Figure 5
Figure 5
Initial unfolding of RST domains based on NMR temperature denaturation.A, 15N,HN chemical shift perturbations (CSPs) for AtTAF4–RST (top) and AtRCD1–RST (bottom) as a function of increasing temperature. Colored horizontal lines indicate the upper quartile CSP of the temperature. The vertical black bars on the right indicate the temperature range used to probe initial unfolding CSPs. B, temperature normalized CSPs of a temperature range corresponding to a change from ∼7.5% to ∼15% unfolded for AtTAF4–RST (red) and AtRCD1–RST (blue). A threshold of mean + 1 standard deviation (dashed line) was used to highlight residues (spherical representation) experiencing larger CSPs than others. For AtRCD1–RST, these congregate around the interface with helix 1. AtRCD1, Arabidopsis thaliana RCD1; AtTAF4, Arabidopsis thaliana transcription initiation factor TFIID-subunit 4; RST, RCD1, SRO, and TAF4.
Figure 6
Figure 6
Model for αα-hub–TF interactions. The degree of structural dynamics and flexibility in the hub may be deterministic for binding of multiple ligands with high affinity through cooperative coupled folding and binding. This is illustrated using the interactions of two different RST domains with the disordered TF AtDREB2A. The malleable AtRCD1–RST domain binds AtDREB2A with high affinity resulting in considerable structuring of both proteins, whereas the less dynamic AtTAF4–RST binds AtDREB2A with lower affinity and much less structuring of DREB2A. AtDREB2A, Arabidopsis thaliana dehydration-responsive element–binding protein 2A; AtRCD1, Arabidopsis thaliana RCD1; AtTAF4, Arabidopsis thaliana transcription initiation factor TFIID-subunit 4; RST, RCD1, SRO, and TAF4; TF, transcription factor.

References

    1. Ma J., Ptashne M. A new class of yeast transcriptional activators. Cell. 1987;51:113–119. - PubMed
    1. Kundu T.K., Palhan V.B., Wang Z., An W., Cole P.A., Roeder R.G. Activator-dependent transcription from chromatin in vitro involving targeted histone acetylation by p300. Mol. Cell. 2000;6:551–561. - PubMed
    1. Reeves W.M., Hahn S. Targets of the Gal4 transcription activator in functional transcription complexes. Mol. Cell Biol. 2005;25:9092–9102. - PMC - PubMed
    1. Berlow R.B., Dyson H.J., Wright P.E. Hypersensitive termination of the hypoxic response by a disordered protein switch. Nature. 2017;543:447–451. - PMC - PubMed
    1. Ptashne M., Gann A. Transcriptional activation by recruitment. Nature. 1997;386:569–577. - PubMed

Publication types

MeSH terms