Predicting brain age from functional connectivity in symptomatic and preclinical Alzheimer disease
- PMID: 35452806
- PMCID: PMC9178744
- DOI: 10.1016/j.neuroimage.2022.119228
Predicting brain age from functional connectivity in symptomatic and preclinical Alzheimer disease
Abstract
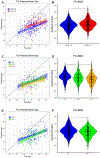
"Brain-predicted age" quantifies apparent brain age compared to normative neuroimaging trajectories. Advanced brain-predicted age has been well established in symptomatic Alzheimer disease (AD), but is underexplored in preclinical AD. Prior brain-predicted age studies have typically used structural MRI, but resting-state functional connectivity (FC) remains underexplored. Our model predicted age from FC in 391 cognitively normal, amyloid-negative controls (ages 18-89). We applied the trained model to 145 amyloid-negative, 151 preclinical AD, and 156 symptomatic AD participants to test group differences. The model accurately predicted age in the training set. FC-predicted brain age gaps (FC-BAG) were significantly older in symptomatic AD and significantly younger in preclinical AD compared to controls. There was minimal correspondence between networks predictive of age and AD. Elevated FC-BAG may reflect network disruption during symptomatic AD. Reduced FC-BAG in preclinical AD was opposite to the expected direction, and may reflect a biphasic response to preclinical AD pathology or may be driven by inconsistency between age-related vs. AD-related networks. Overall, FC-predicted brain age may be a sensitive AD biomarker.
Keywords: Alzheimer disease; Brain aging; Machine learning; Resting-state functional connectivity; fMRI.
Copyright © 2022. Published by Elsevier Inc.
Conflict of interest statement
Declaration of Competing Interest The authors declare no conflicts of interests. JC Morris is funded by NIH grants # P30 AG066444; P01AG003991; P01AG026276; U19 AG032438; and U19 AG024904. Neither Dr. Morris nor his family owns stock or has equity interest (outside of mutual funds or other externally directed accounts) in any pharmaceutical or biotechnology company. Dr. Salloway reports personal fees from EISAI, NOVARTIS, GENENTECH, ROCHE, GEMVAX, AVID, and LILLY. Dr. Bateman is on the scientific advisory board of C2N Diagnostics and reports research support from Abbvie, Avid Radiopharmaceuticals, Biogen, Centene, Eisai, Eli Lilly and Company, Genentech, Hoffman-LaRoche, Janssen, and United Neuroscience.
Figures


References
-
- Aha DW, Bankert RL, 1996. A Comparative Evaluation of Sequential Feature Selection Algorithms, in: Fisher D, Lenz HJ (Eds.), Learning From Data: Lecture Notes in Statistics, Vol. 112. Springer, New York, NY, pp. 199–206. 10.1007/978-1-4612-2404-4_19 - DOI
-
- Bashyam VM, Erus G, Doshi J, Habes M, Nasralah I, Truelove-hill M, Srinivasan D, Mamourian L, Pomponio R, Fan Y, Launer LJ, Masters CL, Maruff P, Zhuo C, Johnson SC, Fripp J, Koutsouleris N, Satterthwaite TD, Wolf D, Gur RE, Gur RC, Morris JC, Albert MS, Grabe HJ, Resnick S, Bryan RN, Wolk DA, Shou H, Davatzikos C, Consortium, I., Consoritum, P.A. disease, ADNI, CARDIA, 2020. MRI signatures of brain age and disease over the lifespan based on a deep brain network and 14 468 individuals worldwide. Brain 1–13. 10.1093/brain/awaa160 - DOI - PMC - PubMed
-
- Bateman RJ, Xiong C, Benzinger TLS, Fagan AM, Goate AM, Fox NC, Marcus DS, Cairns NJ, Xie X, Blazey TM, Holtzman DM, Santacruz A, Buckles V, Oliver A, Moulder K, Aisen PS, Ghetti B, Klunk WE, McDade EM, Martins RN, Masters CL, Mayeux R, Ringman JM, Rossor MN, Schofield PR, Sperling RA, Salloway SP, Morris JC, 2012. Clinical and Biomarker Changes in Dominantly Inherited Alzheimer’s Disease. N. Engl. J. Med 367, 795–804. 10.1056/NEJMoa1202753 - DOI - PMC - PubMed
Publication types
MeSH terms
Substances
Grants and funding
LinkOut - more resources
Full Text Sources
Medical

