

Empirical dynamic modeling of the association between ambient PM2.5 and under-five mortality across 2851 counties in Mainland China, 1999-2012
- PMID: 35453020
- PMCID: PMC9061697
- DOI: 10.1016/j.ecoenv.2022.113513
Empirical dynamic modeling of the association between ambient PM2.5 and under-five mortality across 2851 counties in Mainland China, 1999-2012
Abstract
Background: Ambient fine particulate matter (PM2.5) pollution has been associated with mortality from various diseases, however, its association with under-five mortality rate (U5MR) has remained largely unknown.
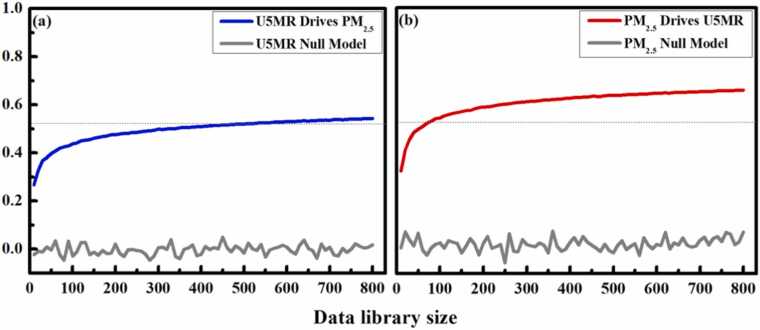
Methods: Based on the U5MR data across 2851 counties in Mainland China from 1999 to 2012, we employed approximate Bayesian latent Gaussian models to assess the association between ambient PM2.5 and U5MR at the county level for the whole nation and sub-regions. GDP growth rate, normalized difference vegetation index (NDVI), temperature, and night-time light were included as covariates using a smoothing function. We further implemented an empirical dynamic model (EDM) to explore the potential causal relationship between PM2.5 and U5MR.
Results: We observed a declining trend in U5MR in most counties throughout the study period. Spatial heterogeneity in U5MR was observed. Nationwide analysis suggested that each 10 µg/m3 increase in annual concentration of PM2.5 was associated with an increase of 1.2 (95% CI: 1.0 - 1.3) per 1000 live births in U5MR. Regional analyses showed that the strongest positive association was located in the Northeastern part of China [1.8 (95% CI: 1.4 - 2.1)]. The EDM showed a significant causal association between PM2.5 and U5MR, with an embedding dimension of 5 and 7, and nonlinear values θ of 4 and 6, respectively.
Conclusion: China exhibited a downward trend in U5MR from 1999 to 2012, with spatial heterogeneity observed across the country. Our analysis reveals a positive association between PM2.5 and U5MR, which may support a causal relationship.
Keywords: Ambient air pollution; Empirical dynamic model; Fine particulate matter pollution; Under five mortality.
Copyright © 2022 The Authors. Published by Elsevier Inc. All rights reserved.
Conflict of interest statement
The authors declare that they have no known competing financial interests or personal relationships that could have appeared to influence the work reported in this paper.
Figures


References
-
- Berger J.O., Insua D.R., Ruggeri F. Bayesian robustness. Robust. Bayesian Anal. 2000:1–32.
-
- Bernardinelli L. Bayesian analysis of space—time variation in disease risk. Stat. Med. 1995;14(21–22):2433–2443. - PubMed
-
- Besag J., York J., Mollié A. Bayesian image restoration, with two applications in spatial statistics. Ann. Inst. Stat. Math. 1991;43(1):1–20.
-
- Blangiardo M. Spatial and spatio-temporal models with R-INLA. Spat Spatiotemporal. Epidemiol. 2013;4:33–49. - PubMed
MeSH terms
Substances
LinkOut - more resources
Full Text Sources
Medical
