On the influence of several factors on pathway enrichment analysis
- PMID: 35453140
- PMCID: PMC9116215
- DOI: 10.1093/bib/bbac143
On the influence of several factors on pathway enrichment analysis
Abstract
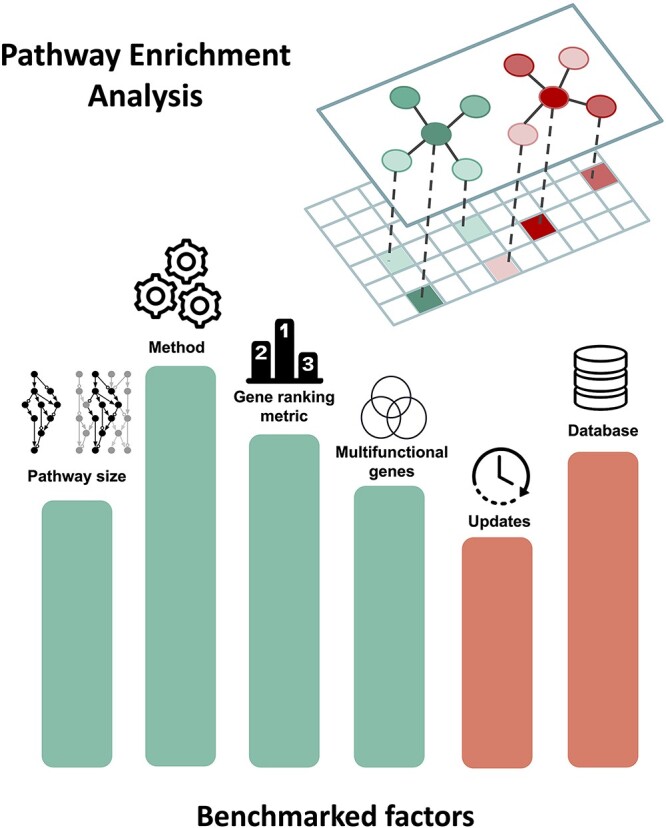
Pathway enrichment analysis has become a widely used knowledge-based approach for the interpretation of biomedical data. Its popularity has led to an explosion of both enrichment methods and pathway databases. While the elegance of pathway enrichment lies in its simplicity, multiple factors can impact the results of such an analysis, which may not be accounted for. Researchers may fail to give influential aspects their due, resorting instead to popular methods and gene set collections, or default settings. Despite ongoing efforts to establish set guidelines, meaningful results are still hampered by a lack of consensus or gold standards around how enrichment analysis should be conducted. Nonetheless, such concerns have prompted a series of benchmark studies specifically focused on evaluating the influence of various factors on pathway enrichment results. In this review, we organize and summarize the findings of these benchmarks to provide a comprehensive overview on the influence of these factors. Our work covers a broad spectrum of factors, spanning from methodological assumptions to those related to prior biological knowledge, such as pathway definitions and database choice. In doing so, we aim to shed light on how these aspects can lead to insignificant, uninteresting or even contradictory results. Finally, we conclude the review by proposing future benchmarks as well as solutions to overcome some of the challenges, which originate from the outlined factors.
Keywords: benchmark; gene set analysis; gene set collection; omics data; pathway database; pathway enrichment.
© The Author(s) 2022. Published by Oxford University Press.
Figures