. 2022 Mar 28;11(4):655.
doi: 10.3390/antiox11040655.

Transcriptomic Analysis of E. coli after Exposure to a Sublethal Concentration of Hydrogen Peroxide Revealed a Coordinated Up-Regulation of the Cysteine Biosynthesis Pathway

Affiliations

Transcriptomic Analysis of E. coli after Exposure to a Sublethal Concentration of Hydrogen Peroxide Revealed a Coordinated Up-Regulation of the Cysteine Biosynthesis Pathway

Myriam Roth et al. Antioxidants (Basel). .

Abstract

Hydrogen peroxide (H2O2) is a key defense component of host-microbe interaction. However, H2O2 concentrations generated by immune cells or epithelia are usually insufficient for bacterial killing and rather modulate bacterial responses. Here, we investigated the impact of sublethal H2O2 concentration on gene expression of E. coli BW25113 after 10 and 60 min of exposure. RNA-seq analysis revealed that approximately 12% of bacterial genes were strongly dysregulated 10 min following exposure to 2.5 mM H2O2. H2O2 exposure led to the activation of a specific antioxidant response and a general stress response. The latter was characterized by a transient down-regulation of genes involved in general metabolism, such as nucleic acid biosynthesis and translation, with a striking and coordinated down-regulation of genes involved in ribosome formation, and a sustained up-regulation of the SOS response. We confirmed the rapid transient and specific response mediated by the transcription factor OxyR leading to up-regulation of antioxidant systems, including the catalase-encoding gene (katG), that rapidly degrade extracellular H2O2 and promote bacterial survival. We documented a strong and transient up-regulation of genes involved in sulfur metabolism and cysteine biosynthesis, which are under the control of the transcription factor CysB. This strong specific transcriptional response to H2O2 exposure had no apparent impact on bacterial survival, but possibly replenishes the stores of oxidized cysteine and glutathione. In summary, our results demonstrate that different stress response mechanisms are activated by H2O2 exposure and highlight the cysteine synthesis as an antioxidant response in E. coli.

Keywords: E. coli; RNA-seq; cysB; cysteine biosynthesis; hydrogen peroxide; oxidative stress; sulfur assimilation.


Conflict of interest statement

The authors declare no conflict of interest.

Figures
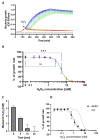
Figure 1
Figure 1
Effect of H2O2 on E. coli BW25113. (A) Bacterial growth of E. coli BW25113 exposed to increasing concentrations of H2O2, added during the exponential phase (OD595nm = 0.2). The color code corresponds to the different H2O2 concentrations depicted in the graph in (B); (means of technical duplicate +/− SD; one representative experiment); (B) Representation of the growth rate (% of the control condition) as a function of H2O2 concentrations. The sublethal concentration was defined as the highest concentration where the growth rate was not significantly different from the control condition, namely 2.5 mM; (mean +/− SD; N = 3; statistical test was ANOVA with Turkey multiple comparison; *** p ≤ 0.001); (C) Quantification of H2O2 degradation using Amplex Red/HRP after addition of 2.5 mM H2O2 to bacterial culture at OD595nm = 0.2 (mean +/− SD; N = 3); (D) Growth rate (% of the control condition) of the katG deleted mutant as a function of the H2O2 concentration, WT from panel B shown as dotted line (mean +/− SD, N = 3).
Figure 2
Figure 2
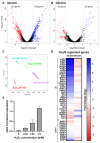
Gene expression at 10 and 60 min after exposure of E. coli BW25113 to 2.5 mM H2O2. Volcano plots representing the dysregulated genes at 10 (A) and 60 min (B) after H2O2 addition compared to respective untreated cells. Blue dots represent significantly up-regulated genes and red dots represent significantly down-regulated genes; thresholds were set as p-value = 0.01 and fold-change ≥ 5; (C) Multi-Dimensional Scaling plot of all samples, each color represent a condition, each dot a sample. Distances between dots represent the coefficient of variation of expression between samples for the top 500 dysregulated genes that best distinguish the samples; (D) Heatmap of the expression of genes of the OxyR regulon with up-regulated genes in blue and down-regulated genes in red [28] (fold change); (E) Catalase katG mRNA expression levels in response to increasing H2O2 concentrations, as measured by qRT-PCR (mean +/− SEM, N = 3).
Figure 3
Figure 3
Comparison of transcriptomic changes at 10 and 60 min; (A) Each gene is represented by a black dot, x-axis: Fold Change (log2) at 10 min (H2O2 vs. untreated control), y-axis: Fold Change (log2) at 60 min (H2O2 vs. untreated control), pink: up-regulated at 10 min, blue: down-regulated at 10 min, green: up-regulated at 60 min, yellow: down-regulated at 60 min; (B) Venn diagram of conditions presented in A documenting the number of genes in each condition.
Figure 4
Figure 4
The top 10 most significant regulators implicated in gene expression changes 10 min after H2O2 exposure, using ISMARA. The significance (z-score) is illustrated for the two time points, 10 min (dark purple) and 60 min (light purple); bars extend to the left if target genes are down-regulated or to the right if they are up-regulated in the H2O2-exposed condition.
Figure 5
Figure 5
Dysregulated metabolic pathways 10 min after H2O2 addition, determined using gene set enrichment analysis. Each dot represents a metabolic pathway from the KEGG database; thresholds: FDR = 0.05, NES (normalized enrichment score) >1 and <−1.
Figure 6
Figure 6
Dysregulation of the sulfur assimilation and cysteine biosynthesis pathways; (A) Heatmap of the differential expression of genes of the CysB regulon (fold-change (log2)); (B) Disk diffusion assay performed with 10 µL of 1 M H2O2, showing one representative experiment of the WT and the cysB and katG deletion mutants; (C) Zone of bacterial growth inhibition assessed by the disk diffusion assay on the WT and the cysB and katG deletion mutants (mean+/− SD; N = 6; statistical test was Kruskal-Wallis with Dunn multiple comparison, ns: p > 0.05, *: p ≤ 0.05, **: p ≤ 0.01).
Figure 7
Figure 7
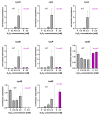
Expression of katG and sulfur metabolism-related genes (cysB, cysE, cysH, cysI, cysJ, cysN. tcyP) by qRT-PCR; the WT and the cysB deleted strain were exposed to the indicated concentrations of H2O2 (N = 3; mean +/− SEM).

References

    1. Barber A.E., Norton J.P., Spivak A.M., Mulvey M.A. Urinary tract infections: Current and emerging management strategies. Clin. Infect. Dis. 2013;57:719–724. doi: 10.1093/cid/cit284. - DOI - PMC - PubMed
    1. Buetti N., Atkinson A., Marschall J., Kronenberg A. Incidence of bloodstream infections: A nationwide surveillance of acute care hospitals in Switzerland 2008–2014. BMJ Open. 2017;7:e013665. doi: 10.1136/bmjopen-2016-013665. - DOI - PMC - PubMed
    1. Federal office of public health FOPH, Communicable Disease Division, Bern Switzerland: How Is Antibiotic Resistance Evolving? [(accessed on 5 November 2021)]. Available online: https://www.bag.admin.ch/bag/en/home/krankheiten/infektionskrankheiten-b....
    1. Tacconelli E. Global Priority List of Antibiotic-Resistant Bacteria to Guide Research, Discovery, and Development of New Antibiotics. World Health Organisation; Geneva, Switzerland: 2017. p. 7.
    1. Sies H., Belousov V.V., Chandel N.S., Davies M.J., Jones D.P., Mann G.E., Murphy M.P., Yamamoto M., Winterbourn C. Defining roles of specific reactive oxygen species (ROS) in cell biology and physiology. Nat. Rev. Mol. Cell Biol. 2022:1–17. doi: 10.1038/s41580-022-00456-z. - DOI - PubMed

LinkOut - more resources