. 2022 Mar 30;11(4):672.
doi: 10.3390/antiox11040672.

Bioactive Compound Profiling of Olive Fruit: The Contribution of Genotype

Affiliations

Bioactive Compound Profiling of Olive Fruit: The Contribution of Genotype

Soraya Mousavi et al. Antioxidants (Basel). .

Abstract

The health, therapeutic, and organoleptic characteristics of olive oil depend on functional bioactive compounds, such as phenols, tocopherols, squalene, and sterols. Genotype plays a key role in the diversity and concentration of secondary compounds peculiar to olive. In this study, the most important bioactive compounds of olive fruit were studied in numerous international olive cultivars during two consecutive seasons. A large variability was measured for each studied metabolite in all 61 olive cultivars. Total phenol content varied on a scale of 1-10 (3831-39,252 mg kg-1) in the studied cultivars. Squalene values fluctuated over an even wider range (1-15), with values of 274 to 4351 mg kg-1. Total sterols ranged from 119 to 969 mg kg-1, and total tocopherols varied from 135 to 579 mg kg-1 in fruit pulp. In the present study, the linkage among the most important quality traits highlighted the scarcity of cultivars with high content of at least three traits together. This work provided sound information on the fruit metabolite profile of a wide range of cultivars, which will facilitate the studies on the genomic regulation of plant metabolites and development of new olive genotypes through genomics-assisted breeding.

Keywords: antioxidant; genotype effect; oleocanthal; oleuropein; olive cultivars; olive fruit; squalene; sterols; verbascoside; α-tocopherol.


Conflict of interest statement

The authors declare no conflict of interest. The funders had no role in the design of the study; in the collection, analyses, or interpretation of data; in the writing of the manuscript; or in the decision to publish the results.

Figures
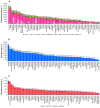
Figure 1
Figure 1
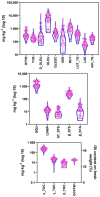
The variation in phenol (A), squalene (B), sterol (C), and tocopherol (D) content in 61 olive cultivars by two-year average (expressed as mg kg−1 of fresh fruit pulp). Different letters correspond to significantly different values of total phenols, total sterols, and total tocopherols at p ≤ 0.01.
Figure 1
Figure 1
The variation in phenol (A), squalene (B), sterol (C), and tocopherol (D) content in 61 olive cultivars by two-year average (expressed as mg kg−1 of fresh fruit pulp). Different letters correspond to significantly different values of total phenols, total sterols, and total tocopherols at p ≤ 0.01.
Figure 2
Figure 2
Violin graphs representing trait variation between two consecutive crop seasons. Each plot shows the distribution of data for 61 cultivars from the minimum to the maximum level, with horizontal inner line showing the data median. The horizontal width of the violin depends on the data density. The pink circles represent the 61 olive cultivars. The data are expressed as mg kg−1 of fruit pulp. The analyzed traits included phenols—hydroxytyrosol (HTYR), tyrosol (TYR), demethyloleuropein (D_OLEU), oleuropein (OLEU), oleocanthal (OLEOC), verbascoside (VER), rutin (RUT), luteolin -7-glycoside (LUT_7G), luteolin (LUE), apigenin-7-glycoside (API_7G); squalene and sterols—squalene (SQU), campesterol (CAMP), stigmasterol (ST_STE), β-sitosterol (β_STE), β-sitostanol (β_STA); tocopherols—α-tocopherol (α_TOC), γ-tocopherol (γ_TOC), β-tocopherol (β_TOC); and oil content on fruit fresh weight (OCFFW).
Figure 3
Figure 3
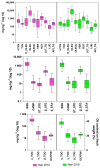
Box and whisker plots for trait variation in each crop season. Each plot shows the distribution of data for 61 cultivars from the minimum to the maximum level, with horizontal inner line showing the data median. The dot sign inside each box shows the mean value. The data are expressed as mg kg−1 of fruit pulp.
Figure 4
Figure 4
The monthly average temperatures and precipitation in two crop seasons (A). Red indicates maximum temperatures, and blue, minimum temperatures. Pearson’s correlation coefficients (B) between the hourly climate data and significantly correlated traits. Dark red and blue colors indicate significant data. Asterisks indicate ** p < 0.01 and * p < 0.05.
Figure 5
Figure 5
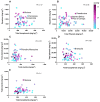
Scatter plot showing multiple regressions among the main traits (total phenols, total tocopherols, total sterols, squalene, and OCFFW). Data are expressed as mg kg−1 of fruit pulp. Violet circles indicate high content of OCFFW, and light blue circles indicate low content of OCFFW.
Figure 6
Figure 6
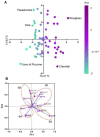
PCA (A) and loading plot (B) representing the distribution of the cultivars based on the 19 traits in two consecutive crop seasons. G1, cultivars rich in seven analyzed phenols and low in sterols; G2, cultivars rich in two phenolic compounds and OCFFW; G3, cultivars rich in tocopherols, one phenolic compound, and one sterol; and G4, cultivars rich in squalene and sterols.

References

    1. Yubero-Serrano E.M., Lopez-Moreno J., Gomez-Delgado F., Lopez-Miranda J. Extra virgin olive oil: More than a healthy fat. Eur. J. Clin. Nutr. 2019;72:8–17. doi: 10.1038/s41430-018-0304-x. - DOI - PubMed
    1. Lozano-Castellón J., López-Yerena A., Rinaldi de Alvarenga J.F., Romero del Castillo-Alba J., Vallverdú-Queralt A., Escribano-Ferrer E., Lamuela-Raventós R.M. Health-promoting properties of oleocanthal and oleacein: Two secoiridoids from extra-virgin olive oil. Crit. Rev. Food. 2020;60:2532–2548. doi: 10.1080/10408398.2019.1650715. - DOI - PubMed
    1. Guclu G., Kelebek H., Selli S. Antioxidant activity in olive oils. In: Preedy V.R., Watson R.R., editors. Olives and Olive Oil in Health and Disease Prevention. 2nd ed. Elsevier Inc.; London, UK: 2021. pp. 313–325.
    1. Dabbou S., Chehab H., Faten B., Dabbou S., Esposto S., Selvaggini R., Taticchi A., Servili M., Montedoro G.F., Hammami M. Effect of three irrigation regimes on Arbequina olive oil produced under Tunisian growing conditions. Agric. Water Manag. 2010;97:763–768. doi: 10.1016/j.agwat.2010.01.011. - DOI
    1. Cayuela J.A., García J.F. Nondestructive measurement of squalene in olive oil by near infrared spectroscopy. LWT. 2018;88:103–108. doi: 10.1016/j.lwt.2017.09.047. - DOI

LinkOut - more resources