. 2022 Mar 24;11(4):495.
doi: 10.3390/biology11040495.

Evaluation of the Cardiometabolic Disorders after Spinal Cord Injury in Mice

Affiliations

Evaluation of the Cardiometabolic Disorders after Spinal Cord Injury in Mice

Adel B Ghnenis et al. Biology (Basel). .

Abstract

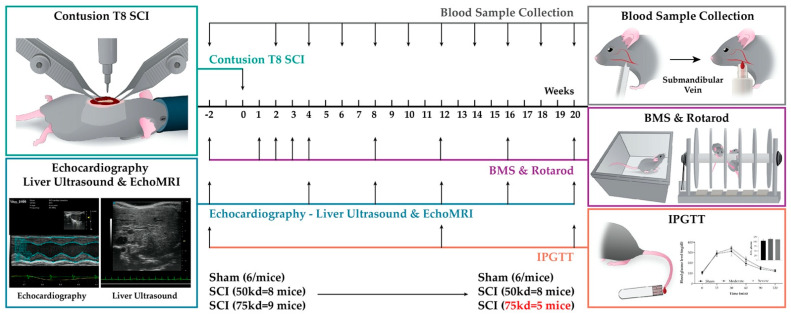
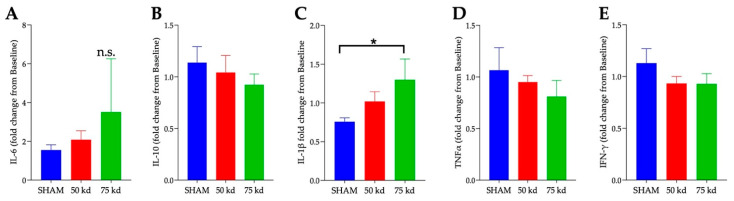
Changes in cardiometabolic functions contribute to increased morbidity and mortality after chronic spinal cord injury. Despite many advancements in discovering SCI-induced pathologies, the cardiometabolic risks and divergences in severity-related responses have yet to be elucidated. Here, we examined the effects of SCI severity on functional recovery and cardiometabolic functions following moderate (50 kdyn) and severe (75 kdyn) contusions in the thoracic-8 (T8) vertebrae in mice using imaging, morphometric, and molecular analyses. Both severities reduced hindlimbs motor functions, body weight (g), and total body fat (%) at all-time points up to 20 weeks post-injury (PI), while only severe SCI reduced the total body lean (%). Severe SCI increased liver echogenicity starting from 12 weeks PI, with an increase in liver fibrosis in both moderate and severe SCI. Severe SCI mice showed a significant reduction in left ventricular internal diameters and LV volume at 20 weeks PI, associated with increased LV ejection fraction as well as cardiac fibrosis. These cardiometabolic dysfunctions were accompanied by changes in the inflammation profile, varying with the severity of the injury, but not in the lipid profile nor cardiac or hepatic tyrosine hydroxylase innervation changes, suggesting that systemic inflammation may be involved in these SCI-induced health complications.

Keywords: cardiometabolic disease; fibrosis; liver and cardiac dysfunctions; spinal cord injury severity.


Conflict of interest statement

The authors declare no conflict of interest.

Figures

Figure 1
Figure 1
Schematic diagram of the experimental design. Six-month-old male mice were used to measure a baseline for Echo MRI, echocardiography (Echo), liver ultrasound, intraperitoneal glucose tolerance test (IPGTT), and body weight (BW). At day 0, T8 contusion SCI was induced, and the same measurements were performed at 4, 8-, 12-, 16-, and 20-weeks post-injury. IPGTT was performed only at the 12 and 20-week time point. Blood plasma was collected twice monthly. For behavioral assessments, BMS and rotarod tests were performed pre-injury and again at days 2 then week 1, 2, 3, 4, 6, 8, 10, 12, 14, 16, 18, and 20 post-injury. At week 20 post-SCI, animals were sacrificed, blood plasma was collected, and tissues (hearts, livers, and spinal cords) were harvested for histological analyses.
Figure 2
Figure 2
Behavioral testing after SCI. BMS scores (A), Rotarod score (B). Behavioral tests performed at baseline before injury and on days 2, 7, 14, 21, 28, and then monthly PI. (C) Percent survival during the experiment. Repeated measures two-way ANOVA: Tukey’s multiple comparisons test was used to determine the differences between the groups. Data presented as means ± SEM, n = 5–9 per group. * p ≤ 0.03, ** p ≤ 0.002, *** p ≤ 0.001.
Figure 3
Figure 3
Injury-severity dependent body composition changes. (A) Body weight (g), (B) percentage of body fat, and (C) percentage of lean body mass. Statistical analysis was performed using repeated measures two-way ANOVA; Tukey’s multiple comparisons test was used to determine the differences between the groups. Data presented as mean ± SEM, n = 6 (sham), 8 (moderate), and 5–9 (severe). * p ≤ 0.03, ** p ≤ 0.002, *** p ≤ 0.001 difference between sham and severe groups and # p ≤ 0.03, ## p ≤ 0.002 difference between sham and moderate groups.
Figure 4
Figure 4
Injury-severity dependent reduction in liver function. SCI induced liver intensity and fibrosis. (A) Representative images of liver show echogenicity of the liver parenchyma increased in the severe group compared to sham group using ultrasound imaging at 20 weeks PI of sham and severe SCI. Red circles located on the liver images represent areas of interest that were quantified. (B) Severe SCI increased liver intensity after 12 weeks PI compared to sham group. Kidney tissue was used as the internal control with data represented as a ratio of hepatic/renal percent change from baseline measurements. (C) Representative liver sections stained with Masson’s trichrome of sham, moderate-SCI, and severe-SCI at 20 weeks PI. (D) Quantification of collagen contents (blue) in the liver. SCI significantly increased fibrotic tissue in severe injured group and there is a trend towards an increase in the moderate group compared to the sham control. Scale bar = 100μm. Values presented as mean ± S.E.M of 3–4 sections/mouse; n = 6 (sham), 8 (moderate), and 5–9 (severe). Data analyzed by two-way ANOVA. Tukey’s multiple comparisons test was used to determine the differences between the groups; one-way ANOVA for D. * p ≤ 0.03, ** p ≤ 0.002, *** p ≤ 0.001.
Figure 5
Figure 5
Injury-severity dependent development of cardiac dysfunction. Echocardiography assessment. (A) Left ventricular internal diameter during systole (LVID;s) and (B) during diastole (LVID;d). (C) LV volume during systole and (D) LV volume during diastole. (E) Ejection fraction (EF) and (F) fractional shortening (FS). n = 6 (sham), 8 (moderate), and 5–9 (severe). Data analyzed by two-way ANOVA. Tukey’s multiple comparisons test was used to determine the differences between the groups. Data presented as mean ± SEM, * p ≤ 0.03, ** p ≤ 0.002, *** p ≤ 0.001.
Figure 6
Figure 6
Injury-severity dependent increase in cardiac remodeling. (A) Representative 40× sections of Masson’s trichrome of sham, moderate-SCI, and severe-SCI after 20 weeks PI. (B) Quantification of collagen contents (blue) in the LV tissue. SCI significantly increased fibrotic tissue in the severe injured group and there is a trend to increase in the moderate group compared to the sham control. (C). LVPW and LVAW thickness. Scale bar = 100 μm. Values presented as mean ± S.E.M of 3–4 sections/mouse; n = 6 (sham), 8 (moderate), and 5–9 (severe). Data analyzed by ANOVA. * p < 0.05 and # p < 0.1.
Figure 7
Figure 7
No changes in glucose metabolism after SCI regardless of the injury severity. IPGTT was performed pre-injury (A), at 12 weeks (B), and at 20 weeks PI (C). (D) Fasting blood glucose concentrations at different time points. No differences are observed for any of these measures. Plasma insulin, cholesterol, and triglyceride levels (E) were tested at 18 weeks PI. Liver triglyceride content (F) was assessed after euthanasia at 20 weeks PI. Values presented as mean ± S.E.M. N = 6 (sham), 8 (moderate), and 5–9 (severe). Data analyzed by two-way ANOVA or one-way ANOVA (DF). * p < 0.05.
Figure 8
Figure 8
Lesion size and relation to behavior and changes in cardiovascular measures. Sample image of spinal cord (severe group) stained with GFAP (green) and DAPI (blue) showing (A) a lesion (white arrow) and (B) a cavity (white asterisk) site. (C) The average lesion, cavity, and total injury size at 5 months post SCI. (D) The percent of mice with cavities at the site of injury. Linear trends of the (E) BMS score at 20 weeks PI, (F) rotarod performance (time on the rod in seconds) at 20 weeks PI, and (G) percent change in LVAW;s in relation to the total injury size of moderate and severe groups. Student’s T-test comparing the means of 2 groups. Linear regression analysis to determine correlation between variables. Data presented as means ± SEM, n = 8 (moderate), and 5 (severe). Linear regression trend line ± 95% confidence interval. Scale bar = 500 µm. * p < 0.05.
Figure 9
Figure 9
Injury-severity dependent increase in pro-inflammatory molecule. Plasma cytokines of (A) IL-6, (B) IL-10, (C) IL-1β, (D) TNF-α, and (E) IFN-γ at 5 months post injury were quantified using MILLIPLEX assay. Values presented as mean ± S.E.M. n = 6 (sham), 8 (moderate), and 5 (severe). Data analyzed by one-way ANOVA. * p < 0.05.
Figure 10
Figure 10
TH staining in the LV and liver. Heart (LVAW, A) and liver (C) 10 μm sections stained for tyrosine hydroxylase (TH) (green) and DAPI (blue) in both sham and sever SCI models. Heart sections from both sham and severe SCI were analyzed for % area of positive TH stain (B). No significant differences in % positive was seen. Liver sections from both sham and severe SCI were also analyzed for % area of positive TH stain (D). Again, no significant differences in % positive was seen. Values presented as mean ± S.E.M. n = 6 (sham) and 5 (severe). Data analyzed by Student’s T-test comparing the means of 2 groups. * p < 0.05. Scale bars = 100 µm.

Similar articles

Cited by

References

    1. SCI Facts and Figures. J. Spinal Cord Med. 2017;40:872–873. doi: 10.1080/10790268.2017.1379938. - DOI - PMC - PubMed
    1. Alizadeh A., Dyck S.M., Karimi-Abdolrezaee S. Traumatic Spinal Cord Injury: An Overview of Pathophysiology, Models and Acute Injury Mechanisms. Front. Neurol. 2019;10:282. doi: 10.3389/fneur.2019.00282. - DOI - PMC - PubMed
    1. Ahuja C.S., Wilson J.R., Nori S., Kotter M.R.N., Druschel C., Curt A., Fehlings M.G. Traumatic spinal cord injury. Nat. Rev. Dis. Primers. 2017;3:17018. doi: 10.1038/nrdp.2017.18. - DOI - PubMed
    1. Sun X., Jones Z.B., Chen X.M., Zhou L., So K.F., Ren Y. Multiple organ dysfunction and systemic inflammation after spinal cord injury: A complex relationship. J. Neuroinflamm. 2016;13:260. doi: 10.1186/s12974-016-0736-y. - DOI - PMC - PubMed
    1. Smith D.L., Jr., Yarar-Fisher C. Contributors to Metabolic Disease Risk Following Spinal Cord Injury. Curr. Phys. Med. Rehabil. Rep. 2016;4:190–199. doi: 10.1007/s40141-016-0124-7. - DOI - PMC - PubMed