. 2022 Mar 24;11(4):497.
doi: 10.3390/biology11040497.

'Fly to a Safer North': Distributional Shifts of the Orchid Ophrys insectifera L. Due to Climate Change

Affiliations

'Fly to a Safer North': Distributional Shifts of the Orchid Ophrys insectifera L. Due to Climate Change

Martha Charitonidou et al. Biology (Basel). .

Abstract

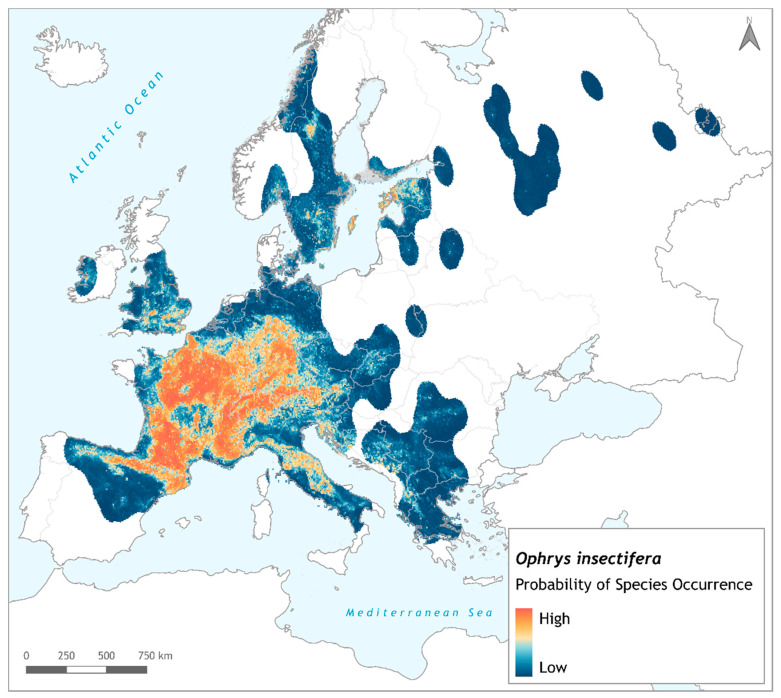
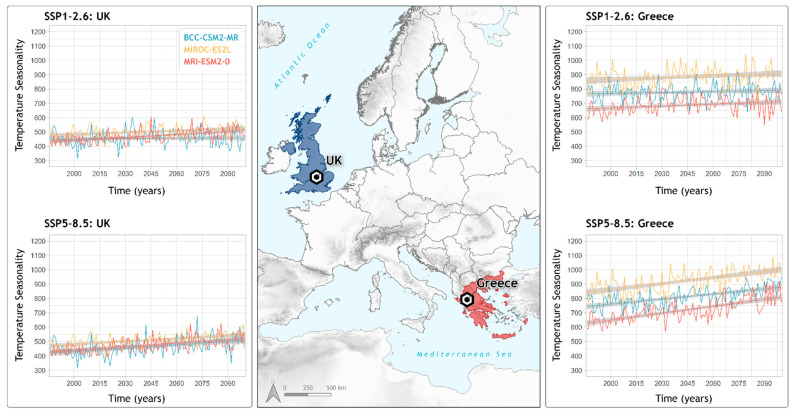
Numerous orchid species around the world have already been affected by the ongoing climate change, displaying phenological alterations and considerable changes to their distributions. The fly orchid (Ophrys insectifera L.) is a well-known and distinctive Ophrys species in Europe, with a broad distribution across the continent. This study explores the effects of climate change on the range of O. insectifera, using a species distribution models (SDMs) framework that encompasses different climatic models and scenarios for the near- and long-term future. The species' environmentally suitable area is projected to shift northwards (as expected) but downhill (contrary to usual expectations) in the future. In addition, an overall range contraction is predicted under all investigated combinations of climatic models and scenarios. While this is moderate overall, it includes some regions of severe loss and other areas with major gains. Specifically, O. insectifera is projected to experience major area loss in its southern reaches (the Balkans, Italy and Spain), while it will expand its northern limits to North Europe, with the UK, Scandinavia, and the Baltic countries exhibiting the largest gains.

Keywords: Ophrys; Orchidaceae; climate change; fly orchid; orchid distribution; range contraction; range shift; species distribution models (SDMs).


Conflict of interest statement

The authors declare no conflict of interest. The funders had no role in the design of the study, in the collection, analyses, or interpretation of data, in the writing of the manuscript, or in the decision to publish the results.

Figures

Figure 1
Figure 1
(a) Ophrys insectifera distribution map, compiled with data downloaded from IUCN [53], (b) map including the total occurrence data for O. insectifera retrieved from GBIF and other sources, and the study area defined as a buffered α-hull extent of occurrence (EOO). Both maps are designed in QGIS v.3.18 ‘Zürich’, using ETRS89—Lambert Conformal Conic Coordinate Reference System. Photo of the species taken in June 2019 at Mt. Tzoumérka (Epirus, NW Greece).
Figure 2
Figure 2
Current habitat suitability map for Ophrys insectifera, for the ensemble model using the environmental thinning procedure. Map is designed in QGIS v.3.18 ‘Zürich’, using ETRS89—Lambert Conformal Conic Coordinate Reference System.
Figure 3
Figure 3
Current and future potential distribution maps for Ophrys insectifera EnvThin ensemble model. Left-hand panel: red-brown coloring indicates the cells the species currently potentially occupies. Each map is showing the transition from the present time-period to each respective GCM and SSP combination. Right-hand panel: future potential distribution maps of 2070 for the combinations of three GCMs (BCC, MIROC, and MRI) and two SSPs (SSP1-2.6 and SSP5-8.5) as ‘best’ and ‘worst’ case scenario. Grid cells with red coloring indicate the areas where the species is currently present but will not be in the future. Grey coloring represents cells where the species currently occupies and will continue to occupy in the future. White stands for the cells where the species is not currently present will not be in the future, while blue grid cells indicate the areas where the species is not currently present but will occupy in the future. All maps are designed in QGIS v.3.18 ‘Zürich’, using ETRS89—Lambert Conformal Conic Coordinate Reference System.
Figure 4
Figure 4
Median centroids for current and future projected distributions of Ophrys insectifera, for the EnvThin ensemble in 2070 time slice. Black point represents the current distribution’s median centroid, the blue points stand for the future best-case scenario (SSP1-2.6), and the magenta points for the future worst-case scenario (SSP5-8.5). GCMs differentiate by shape: BCC—circle, MIROC—diamond, MRI—square. Map is designed in QGIS v.3.18 ‘Zürich’, using ETRS89—Lambert Conformal Conic Coordinate Reference System.
Figure 5
Figure 5
Temperature seasonality variation for two selected locations of Ophrys insectifera distribution over the time period 1986–2100. UK (in blue) represents an area of range gain, while Greece (in red) an area of range loss. Two shared socioeconomic pathways (SSPs) are presented, as best-case and worst-case scenarios (SSP1-2.6 and SSP5-8.5, respectively). In all panels, each line represents a global circulation model (GCM): BCC-CSM2-MR (cyan line); MIROC-ES2L (yellow line); MRI-ESM2-0 (coral red line).

References

    1. IPCC . In: Climate Change 2021: The Physical Science Basis. Contribution of Working Group I to the Sixth Assessment Report of the Intergovernmental Panel on Climate Change. Masson-Delmotte V., Zhai P., Pirani A., Connors S.L., Péan C., Berger S., Caud N., Chen Y., Goldfarb L., Gomis M.I., et al., editors. Cambridge University Press; Cambridge, UK: 2022. In Press .
    1. Walther G.-R., Post E., Convey P., Menzel A., Parmesan C., Beebee T.J.C., Fromentin J.-M., Hoegh-Guldberg O., Bairlein F. Ecological responses to recent climate change. Nature. 2002;416:389–395. doi: 10.1038/416389a. - DOI - PubMed
    1. Parmesan C. Ecological and evolutionary responses to recent climate change. Annu. Rev. Ecol. Evol. Syst. 2006;37:637–669. doi: 10.1146/annurev.ecolsys.37.091305.110100. - DOI
    1. Chen I.C., Hill J.K., Ohlemüller R., Roy D.B., Thomas C.D. Rapid range shifts of species associated with high levels of climate warming. Science. 2011;333:1024–1026. doi: 10.1126/science.1206432. - DOI - PubMed
    1. Lenoir J., Gégout J.C., Marquet P.A., De Ruffray P., Brisse H. A significant upward shift in plant species optimum elevation during the 20th century. Science. 2008;320:1768–1771. doi: 10.1126/science.1156831. - DOI - PubMed

LinkOut - more resources