. 2022 Apr 15;11(4):603.
doi: 10.3390/biology11040603.

The Effect of Hypothermia and Osmotic Shock on the Electrocardiogram of Adult Zebrafish

Affiliations

The Effect of Hypothermia and Osmotic Shock on the Electrocardiogram of Adult Zebrafish

Elodie Arel et al. Biology (Basel). .

Abstract

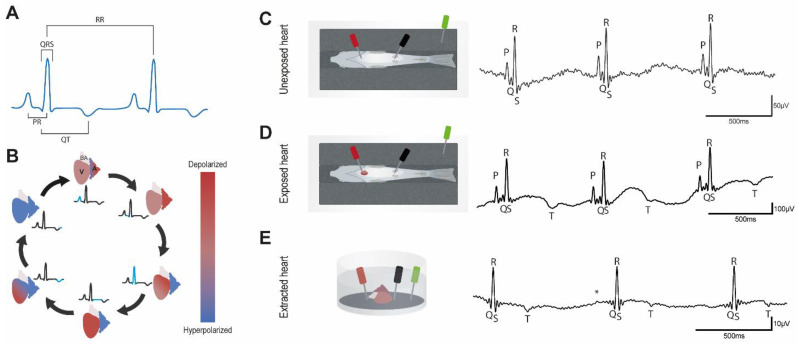
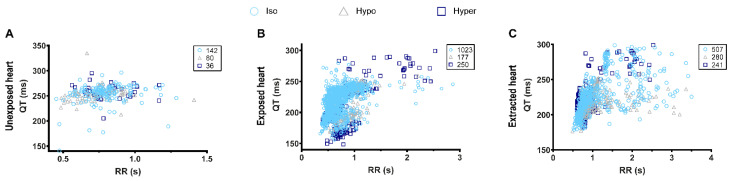
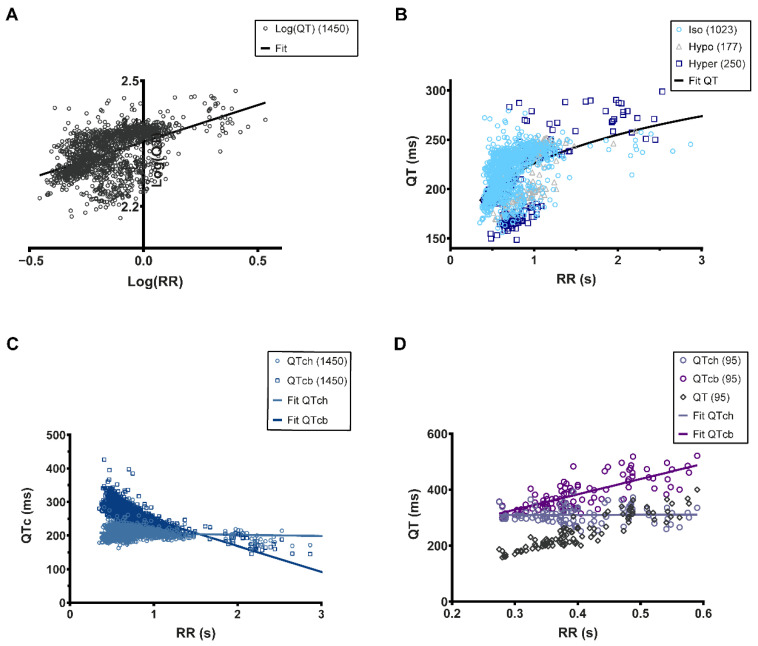
The use of zebrafish to explore cardiac physiology has been widely adopted within the scientific community. Whether this animal model can be used to determine drug cardiac toxicity via electrocardiogram (ECG) analysis is still an ongoing question. Several reports indicate that the recording configuration severely affects the ECG waveforms and its derived-parameters, emphasizing the need for improved characterization. To address this problem, we recorded ECGs from adult zebrafish hearts in three different configurations (unexposed heart, exposed heart, and extracted heart) to identify the most reliable method to explore ECG recordings at baseline and in response to commonly used clinical therapies. We found that the exposed heart configuration provided the most reliable and reproducible ECG recordings of waveforms and intervals. We were unable to determine T wave morphology in unexposed hearts. In extracted hearts, ECG intervals were lengthened and P waves were unstable. However, in the exposed heart configuration, we were able to reliably record ECGs and subsequently establish the QT-RR relationship (Holzgrefe correction) in response to changes in heart rate.

Keywords: Bazett’s formula; electrocardiogram; hyperosmotic therapy; hypothermic therapy; longitudinal studies; zebrafish.


Conflict of interest statement

The authors declare no conflict of interest.

Figures

Figure 1
Figure 1
ECG representation and typical recordings; (A), Schematic representation of the interval measurement method. We chose to take the peak of the P and T waves to determine PR and QT intervals respectively to reduce the uncertainty of the measurements when taking before P waves or after T waves; (B), Cartoon representing the different depolarization and repolarization steps of the zebrafish heart cavities. A: atrium, V: ventricle, BA: bulbus arteriosus; (CE), Schematic representation of the electrode positioning in the different configurations and representative traces; (C), Unexposed heart; (D), Exposed heart; (E), Extracted heart, * indicates putative P wave. Traces show three consecutive ECG complexes after application of a 50 Hz low-pass filter.
Figure 2
Figure 2
QT-RR relationship in different configurations of ECG measurement. (A), Unexposed heart; (B), exposed heart; (C), extracted heart. The number of individual QT-RR pairs, obtained in isosmotic, hyposmotic, and hyperosmotic conditions, is presented in the upper right corner of each graph and was obtain from n = 3 (unexposed heart), n = 10 (exposed heart), and n = 6 (extracted heart) adult zebrafish.
Figure 3
Figure 3
QT-RR relationship in different configurations of ECG measurement. (A), Unexposed heart; (B), exposed heart; (C), extracted heart. The number of individual QT-RR pairs, obtained in warm and cool conditions is presented in the upper right corner of each graph and was obtain from 5 (unexposed heart), 9 (exposed heart) and 7 (extracted heart) fish.
Figure 4
Figure 4
QT-RR relationship fitting. (A), Linear fitting (black line) of the Log(QT)–Log(RR) relationship). The slope of the relationship is 0.2064; (B), Non-linear fitting (black line) of the QT-RR relationship using the characteristics of the fitting shown in (A); (C), QTc-RR relationship using Holzgrefe’s correction formula (QTch) and Bazett’s equation (QTcb). These relationships were linearly fitted (blue-grey line: QTch; navy line: QTcb); (D), QT-RR relationship from the data published in Milan et al., 2006. The QT-RR raw data are in open black diamonds. The QT corrected by the Holzgrefe’s equation, QTch, are lilac opened circles, and the corresponding linear fitting is the lilac line, while the QT corrected by Bazett’s formula are opened purple circles and the corresponding linear fitting if the purple line. The number of individual QT-RR pairs is presented in the upper right corner of each graph.

Similar articles

Cited by

References

    1. Milan D.J., Jones I.L., Ellinor P.T., MacRae C.A. In Vivo Recording of Adult Zebrafish Electrocardiogram and Assessment of Drug-Induced QT Prolongation. Am. J. Physiol. Heart Circ. Physiol. 2006;291:H269–H273. doi: 10.1152/ajpheart.00960.2005. - DOI - PubMed
    1. Arnaout R., Ferrer T., Huisken J., Spitzer K., Stainier D.Y.R., Tristani-Firouzi M., Chi N.C. Zebrafish Model for Human Long QT Syndrome. Proc. Natl. Acad. Sci. USA. 2007;104:11316–11321. doi: 10.1073/pnas.0702724104. - DOI - PMC - PubMed
    1. Chaudhari G.H., Chennubhotla K.S., Chatti K., Kulkarni P. Optimization of the Adult Zebrafish ECG Method for Assessment of Drug-Induced QTc Prolongation. J. Pharmacol. Toxicol. Methods. 2013;67:115–120. doi: 10.1016/j.vascn.2013.01.007. - DOI - PubMed
    1. Liu C.C., Li L., Lam Y.W., Siu C.W., Cheng S.H. Improvement of Surface ECG Recording in Adult Zebrafish Reveals That the Value of This Model Exceeds Our Expectation. Sci. Rep. 2016;6:25073. doi: 10.1038/srep25073. - DOI - PMC - PubMed
    1. Lin M.-H., Chou H.-C., Chen Y.-F., Liu W., Lee C.-C., Liu L.Y.-M., Chuang Y.-J. Development of a Rapid and Economic in Vivo Electrocardiogram Platform for Cardiovascular Drug Assay and Electrophysiology Research in Adult Zebrafish. Sci. Rep. 2018;8:15986. doi: 10.1038/s41598-018-33577-7. - DOI - PMC - PubMed

LinkOut - more resources