

Soluble Angiotensin-Converting Enzyme 2 as a Prognostic Biomarker for Disease Progression in Patients Infected with SARS-CoV-2
- PMID: 35453934
- PMCID: PMC9031748
- DOI: 10.3390/diagnostics12040886
Soluble Angiotensin-Converting Enzyme 2 as a Prognostic Biomarker for Disease Progression in Patients Infected with SARS-CoV-2
Abstract
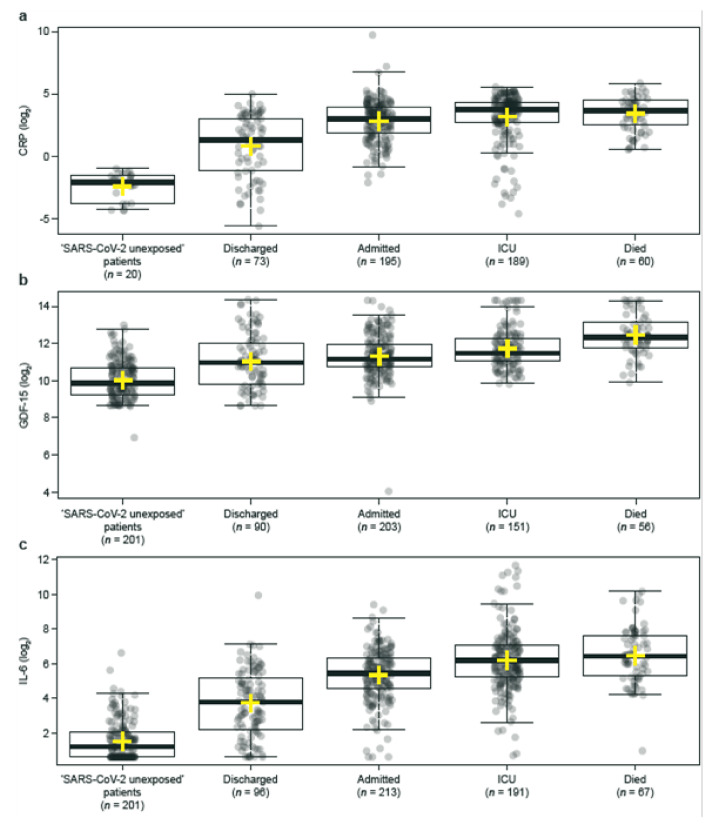
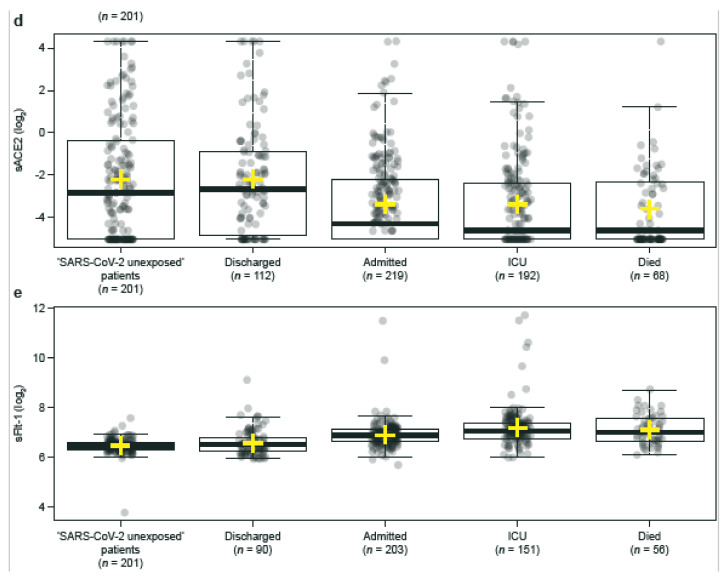
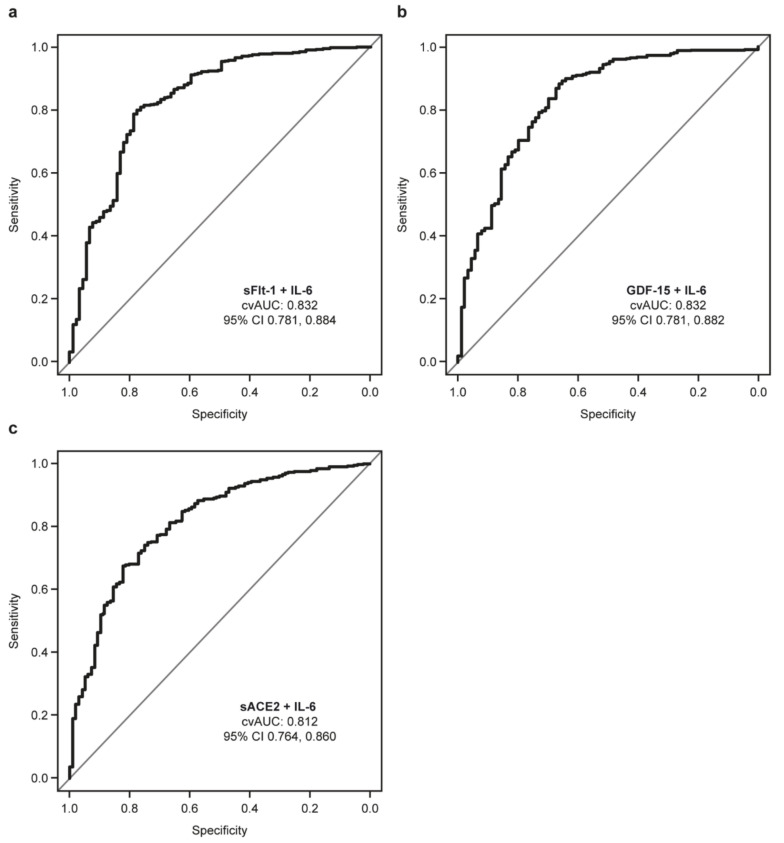
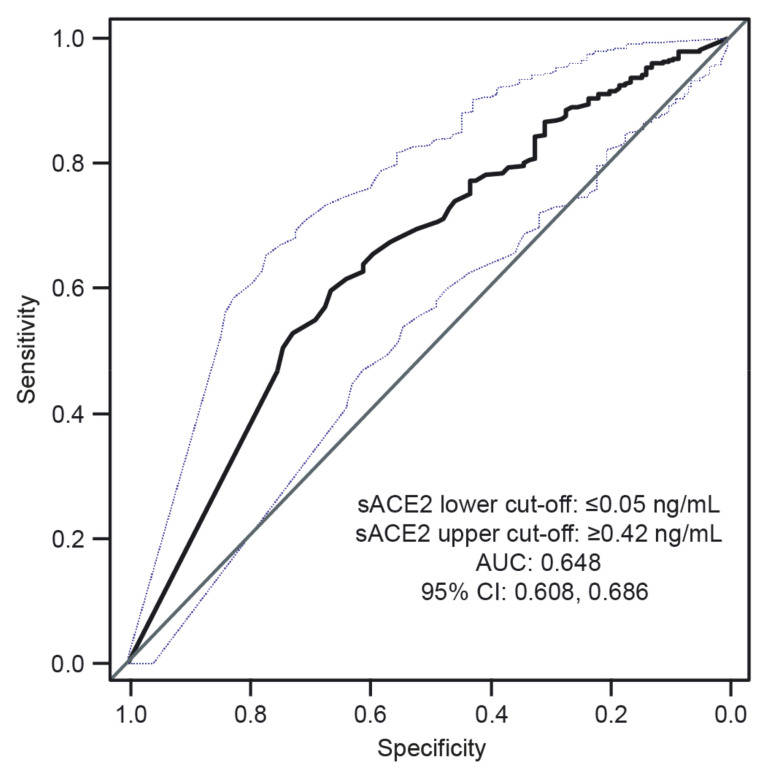
Predicting disease severity in patients infected with SARS-CoV-2 is difficult. Soluble angiotensin-converting enzyme 2 (sACE2) arises from the shedding of membrane ACE2 (mACE2), which is a receptor for SARS-CoV-2 spike protein. We evaluated the predictive value of sACE2 compared with known biomarkers of inflammation and tissue damage (CRP, GDF-15, IL-6, and sFlt-1) in 850 patients with and without SARS-CoV-2 with different clinical outcomes. For univariate analyses, median differences between biomarker levels were calculated for the following patient groups (classified by clinical outcome): RT-PCR-confirmed SARS-CoV-2 positive (Groups 1−4); RT-PCR-confirmed SARS-CoV-2 negative following previous SARS-CoV-2 infection (Groups 5 and 6); and ‘SARS-CoV-2 unexposed’ patients (Group 7). Median levels of CRP, GDF-15, IL-6, and sFlt-1 were significantly higher in hospitalized patients with SARS-CoV-2 compared with discharged patients (all p < 0.001), whereas levels of sACE2 were significantly lower (p < 0.001). ROC curve analysis of sACE2 provided cut-offs for predicting hospital admission (≤0.05 ng/mL (positive predictive value: 89.1%) and ≥0.42 ng/mL (negative predictive value: 84.0%)). These findings support further investigation of sACE2, as a single biomarker or as part of a panel, to predict hospitalization risk and disease severity in patients with SARS-CoV-2 infection.
Keywords: COVID-19; SARS-CoV-2; SARS-CoV-2 spike protein; angiotensin-converting enzyme 2; biomarkers; disease severity; inflammation.
Conflict of interest statement
S.W. and M.K. are employees of Roche Diagnostics GmbH and hold shares in F. Hoffmann-La Roche Ltd. The other authors report no potential conflict of interest.
Figures
References
-
- Ghebreyesus T.A. WHO Director-General’s Opening Remarks at the Media Briefing on COVID-19. 2020. [(accessed on 11 March 2020)]. Available online: https://www.who.int/director-general/speeches/detail/who-director-genera....
-
- Wynants L., Van Calster B., Collins G.S., Riley R.D., Heinze G., Schuit E., Bonten M.M.J., Dahly D.L., Damen J.A., Debray T.P.A., et al. Prediction models for diagnosis and prognosis of COVID-19: Systematic review and critical appraisal. BMJ. 2020;369:m1328. doi: 10.1136/bmj.m1328. - DOI - PMC - PubMed
-
- Hodges G., Pallisgaard J., Olsen A.-M.S., Mcgettigan P., Andersen M., Krogager M., Kragholm K., Køber L., Gislason G.H., Torp-Pedersen C., et al. Association between biomarkers and COVID-19 severity and mortality: A nationwide Danish cohort study. BMJ Open. 2020;10:e041295. doi: 10.1136/bmjopen-2020-041295. - DOI - PMC - PubMed
Grants and funding
LinkOut - more resources
Full Text Sources
Other Literature Sources
Medical
Research Materials
Miscellaneous
