. 2022 Mar 25;12(4):499.
doi: 10.3390/biom12040499.

In Silico Analysis of the Antagonist Effect of Enoxaparin on the ApoE4-Amyloid-Beta (A β) Complex at Different pH Conditions

Affiliations

In Silico Analysis of the Antagonist Effect of Enoxaparin on the ApoE4-Amyloid-Beta (A β) Complex at Different pH Conditions

Jorge Alberto Aguilar-Pineda et al. Biomolecules. .

Abstract

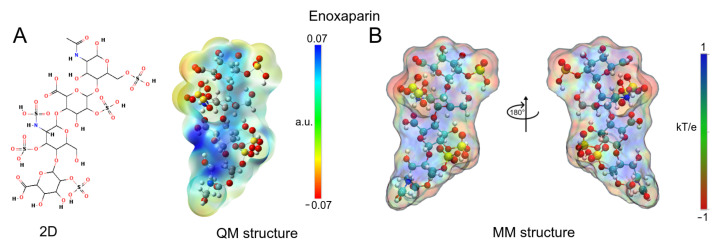
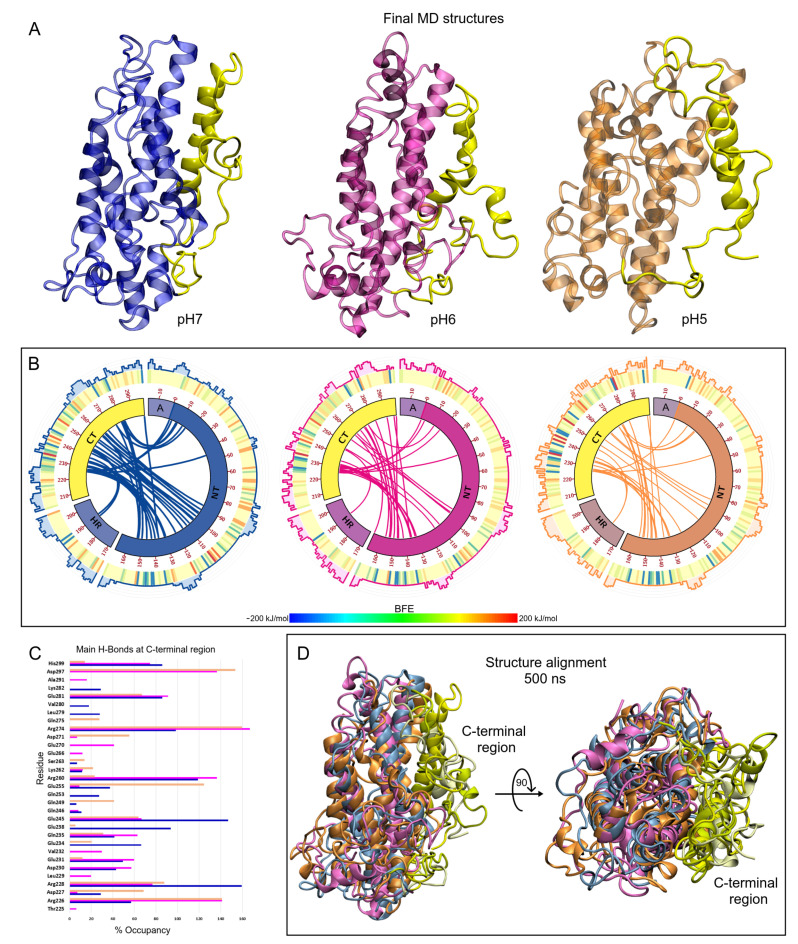
Apolipoprotein E4 (ApoE4) is thought to increase the risk of developing Alzheimer's disease. Several studies have shown that ApoE4-Amyloid β (Aβ) interactions can increment amyloid depositions in the brain and that this can be augmented at low pH values. On the other hand, experimental studies in transgenic mouse models have shown that treatment with enoxaparin significantly reduces cortical Aβ levels, as well as decreases the number of activated astrocytes around Aβ plaques. However, the interactions between enoxaparin and the ApoE4-Aβ proteins have been poorly explored. In this work, we combine molecular dynamics simulations, molecular docking, and binding free energy calculations to elucidate the molecular properties of the ApoE4-Aβ interactions and the competitive binding affinity of the enoxaparin on the ApoE4 binding sites. In addition, we investigated the effect of the environmental pH levels on those interactions. Our results showed that under different pH conditions, the closed form of the ApoE4 protein, in which the C-terminal domain folds into the protein, remains stabilized by a network of hydrogen bonds. This closed conformation allowed the generation of six different ApoE4-Aβ interaction sites, which were energetically favorable. Systems at pH5 and 6 showed the highest energetic affinity. The enoxaparin molecule was found to have a strong energetic affinity for ApoE4-interacting sites and thus can neutralize or disrupt ApoE4-Aβ complex formation.

Keywords: alzheimer disease; amyloid-β; apolipoprotein E; enoxaparin; molecular dynamics.


Conflict of interest statement

The authors declare no conflict of interest.

Figures

Figure 1
Figure 1
QM and MM of enoxaparin (Enx) structures. (A) 2D and 3D depiction of Enx. The optimized structure and ESP surfaces were obtained by DFT calculations. (B) ESP surfaces were obtained with APBS methodology and Hirshfeld atomic charges. On all surfaces, the different colors indicate their molecular electrostatic properties; red for the most nucleophilic zones; dark blue for the most electrophilic zones, and green for neutral.
Figure 2
Figure 2
The initial structure of ApoE4 and its stability indicators. (A) Main regions of full-ApoE4 structure. Blue color corresponds to N-terminal; yellow color to Hinge region and red color to C-terminal region. (B) Root mean square deviation. (C) Solvent accessible surface area. (D) Radius of gyration. (E) Hydrogen bonds.
Figure 3
Figure 3
Fluctuation analysis of the ApoE4 structures. (A) RMSF plot of the last 300 ns of the MD trajectories. The largest fluctuation in the structures is shown in the red box. (B) B-factor mapped onto ApoE4 structures at different pH. The marked area corresponds to the region of greatest fluctuation. Green, white, and red colors indicate low, intermediate, and high fluctuations, respectively.
Figure 4
Figure 4
Final structures of the ApoE4 after 500 ns MD simulations. (A) Minimum energy structures of ApoE4 under different pH conditions. (B) Circos diagrams of the full-length ApoE4 structure. The main domains are represented by bands and the internal colored lines indicate hydrogen bonds between residues. Orange, magenta, and blue colors represent pH5, 6, and 7 conditions, respectively. The outer graphs represent the BFE heat map and the epitope probabilities for each residue. On the heat maps, blue, yellow, and red colors indicate favorable, neutral, and unfavorable BFE, respectively. In the epitope plots, the same color scheme was used to represent the different pH conditions. (C) H-bond occupancy formed between C-terminal residues and the remaining residues of the ApoE4 structure along the MD trajectory. Color bars indicate different H-bonds for each residue. (D) Structural alignment of ApoE4-Aβ complexes at different pHs after 500 ns of MD calculations.
Figure 5
Figure 5
Results of the MD simulations on the Aβ structure. (A) Alignment of the initial structure with the minimum energy structures obtained at the studied pHs. (B) Stability indicators for the analyzed systems. (C) Network of hydrogen bonds in the compact structures of the Aβ and its effect on the electrostatic properties of the systems. The blue color indicates electrophilic regions, the color red, nucleophilic regions, and the white, neutral regions.
Figure 6
Figure 6
ApoE4 and Aβ interaction sites at different pHs obtained by molecular docking calculations. (A) Structures at pH7 and interaction sites found. (B) Sites of interaction at pH6. (C) Sites of interaction at pH5. In all figures, peptide Aβ is in green, and the surface of the ApoE4 structure is in gray. The colors of the interaction sites are the same for all pHs, S1 (yellow), S2 (purple), S3 (red), S4 (blue), S5 (orange), and S6 (magenta).
Figure 7
Figure 7
H-bond interactions at S1 site in ApoE4-Aβ-Enx complexes. (A) At pH7; (B) at pH6; and (C) at pH5. For ApoE4 residues, the colors blue, magenta, and orange were used to represent pH conditions, respectively. For all pH values, the Aβ residues were colored green and the Enx molecule cyan.
Figure 8
Figure 8
MM-PBSA calculation of BFE per residues in the S1 interaction site at different pHs. The left panel shows the ApoE4 residues with the strongest binding energies with Aβ as ligand. The right panel with Enx as ligand. The same color code was used for both panels to represent the different pH conditions.
Figure 9
Figure 9
MM-PBSA calculation of BFE by residues for all ApoE4-Aβ-Enx complexes at the pHs studied. The left panels show the BFE per residue of the ApoE4-Aβ complexes with the highest energetic affinity for each interaction site. In the right panels the ApoE4-Enx complexes are shown. The color code used for each site was the same as that used for the docking sites, except for site S1, which is black for a better representation.

Similar articles

Cited by

References

    1. Long J.M., Holtzman D.M. Alzheimer disease: An update on pathobiology and treatment strategies. Cell. 2019;179:312–339. doi: 10.1016/j.cell.2019.09.001. - DOI - PMC - PubMed
    1. Alzheimer’s Association 2021 Alzheimer’s disease facts and figures. Alzheimer’s Dement. 2021;17:327–406. doi: 10.1002/alz.12328. - DOI - PubMed
    1. Schindler S.E., McConathy J., Ances B.M., Diamond M.I. Advances in diagnostic testing for Alzheimer disease. Mo. Med. 2013;110:401–405. - PMC - PubMed
    1. Nakamura A., Kaneko N., Villemagne V.L., Kato T., Doecke J., Doré V., Fowler C., Li Q.X., Martins R., Rowe C., et al. High performance plasma amyloid-β biomarkers for Alzheimer’s disease. Nature. 2018;554:249–254. doi: 10.1038/nature25456. - DOI - PubMed
    1. Kiddle S.J., Voyle N., Dobson R.J.B. A Blood Test for Alzheimer’s Disease: Progress, Challenges, and Recommendations. J. Alzheimer’s Dis. 2018;64:S289–S297. doi: 10.3233/JAD-179904. - DOI - PMC - PubMed

Publication types