

Plasma Polyamine Biomarker Panels: Agmatine in Support of Prostate Cancer Diagnosis
- PMID: 35454104
- PMCID: PMC9024899
- DOI: 10.3390/biom12040514
Plasma Polyamine Biomarker Panels: Agmatine in Support of Prostate Cancer Diagnosis
Abstract
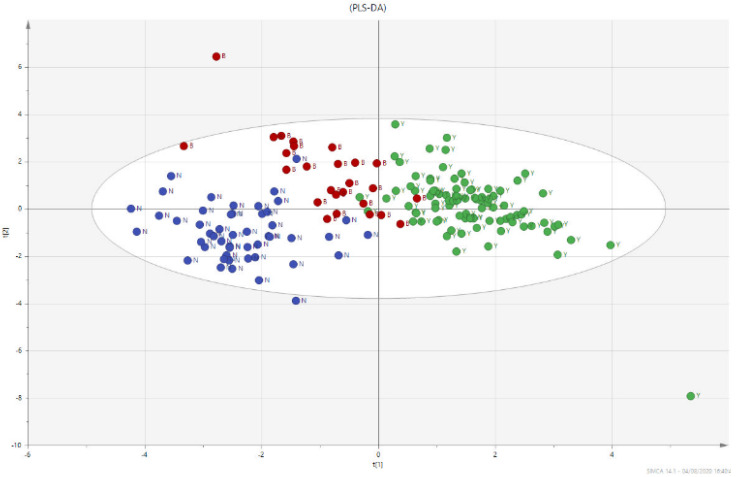
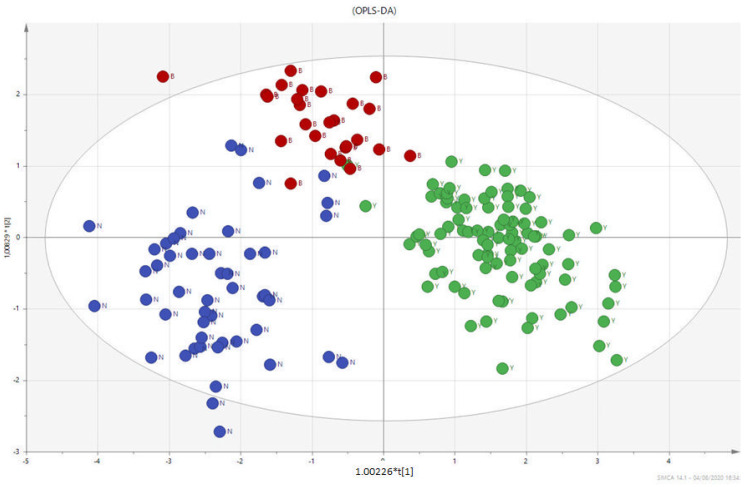
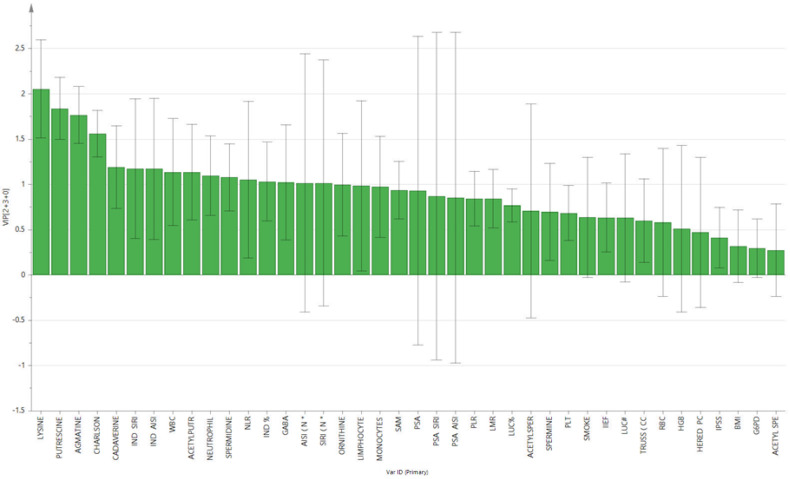
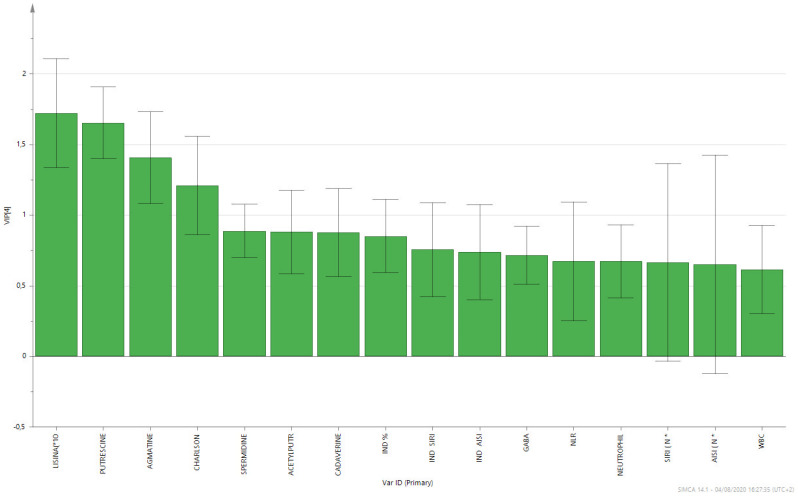
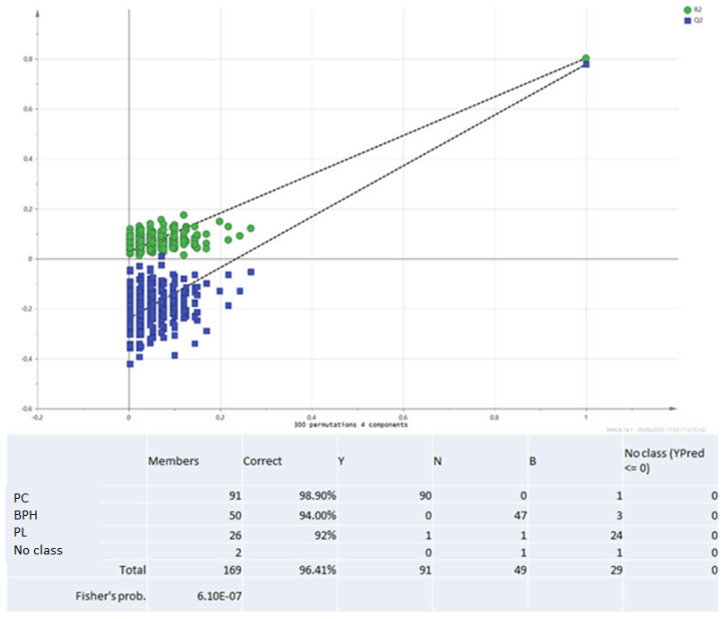
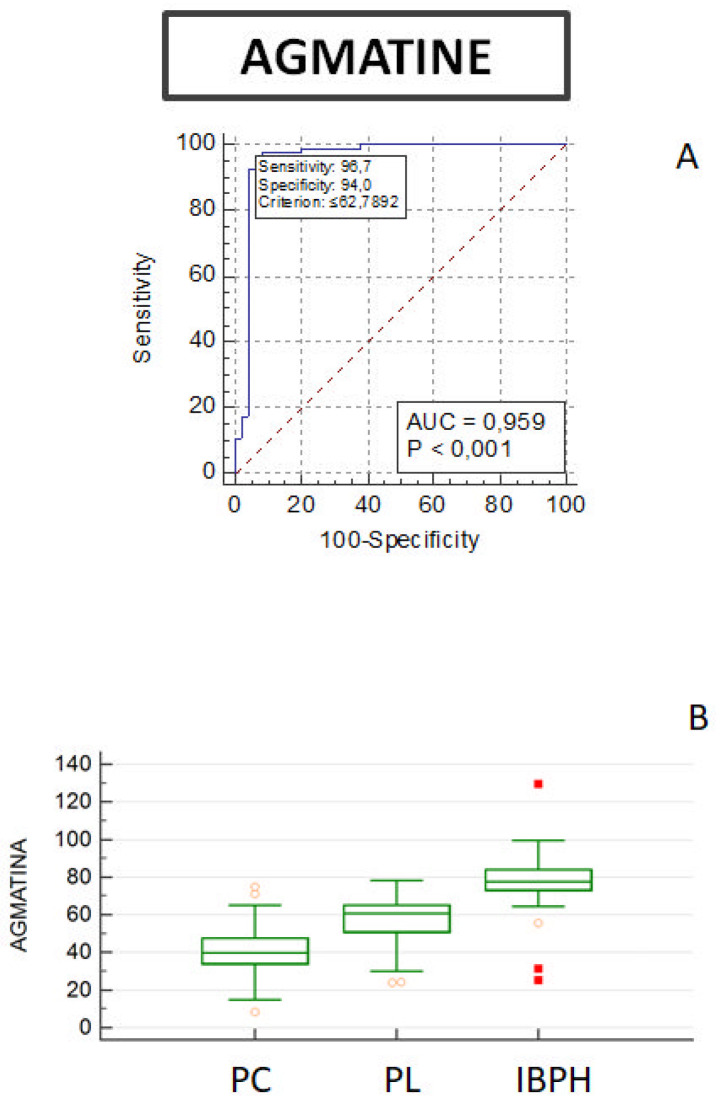
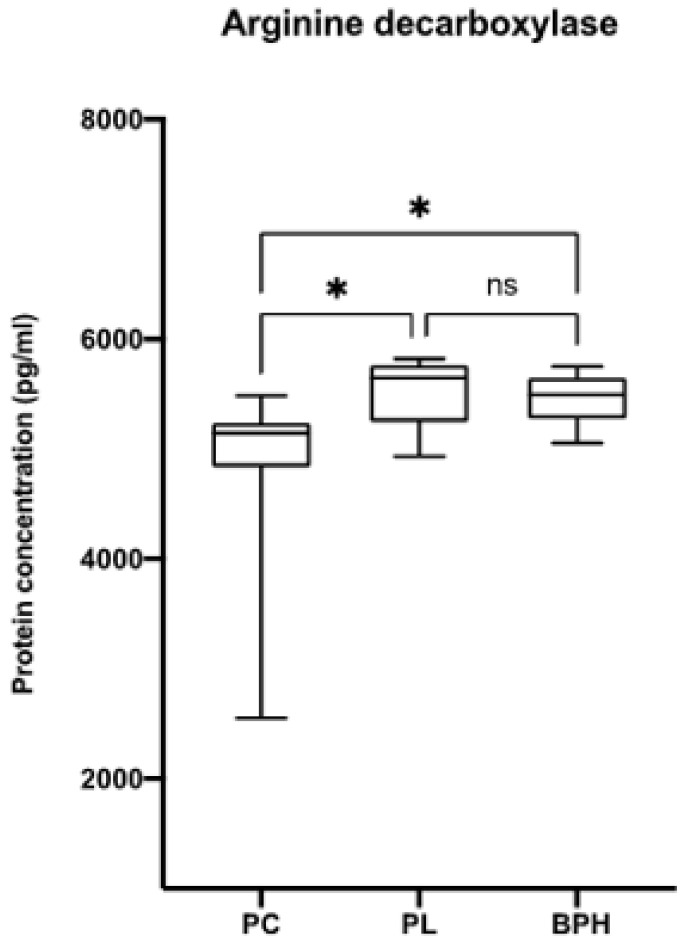
Prostate cancer is the most frequent malignant tumour among males (19%), often clinically silent and of difficult prognosis. Although several studies have highlighted the diagnostic and prognostic role of circulating biomarkers, such as PSA, their measurement does not necessarily allow the detection of the disease. Within this context, many authors suggest that the evaluation of circulating polyamines could represent a valuable tool, although several analytical problems still counteract their clinical practice. In particular, agmatine seems particularly intriguing, being a potential inhibitor of polyamines commonly derived from arginine. The aim of the present work was to evaluate the potential role of agmatine as a suitable biomarker for the identification of different classes of patients with prostate cancer (PC). For this reason, three groups of human patients-benign prostatic hyperplasia (BPH), precancerous lesion (PL), and prostate cancer (PC)-were recruited from a cohort of patients with suspected prostate cancer (n = 170), and obtained plasma was tested using the LC-HRMS method. Statistics on the receiver operating characteristics curve (ROC), and multivariate analysis were used to examine the predictive value of markers for discrimination among the three patient groups. Statistical analysis models revealed good discrimination using polyamine levels to distinguish the three classes of patients. AUC above 0.8, sensitivity ranging from 67% to 89%, specificity ranging from 74% to 89% and accuracy from 73% to 86%, considering the validation set, were achieved. Agmatine plasma levels were measured in PC (39.9 ± 12.06 ng/mL), BPH (77.62 ± 15.05 ng/mL), and PL (53.31 ± 15.27 ng/mL) patients. ROC analysis of the agmatine panel showed an AUC of 0.959 and p ≤ 0.001. These results could represent a future tool able to discriminate patients belonging to the three different clinical groups.
Keywords: LC-HRMS; agmatine; biomarkers; prostate cancer.
Conflict of interest statement
The authors declare no conflict of interest. The authors declare that they have no known competing financial interests or personal relationships that could have appeared to influence the work reported in this paper.
Figures
References
-
- Boyle H., Alibhai S., Decoster L., Efstathiou E., Fizazi K., Mottet N., Oudard S., Payne H., Prentice M., Puts M., et al. Updated recommendations of the International Society of Geriatric Oncology on prostate cancer management in older patients. Eur. J. Cancer. 2019;116:116–136. doi: 10.1016/j.ejca.2019.04.031. - DOI - PubMed
Publication types
MeSH terms
Substances
LinkOut - more resources
Full Text Sources
Medical
Research Materials
Miscellaneous
