. 2022 Apr 8;12(8):959.
doi: 10.3390/ani12080959.

Effects of Pathogenic Escherichia coli Infection on the Flora Composition, Function, and Content of Short-Chain Fatty Acids in Calf Feces

Affiliations

Effects of Pathogenic Escherichia coli Infection on the Flora Composition, Function, and Content of Short-Chain Fatty Acids in Calf Feces

Lina He et al. Animals (Basel). .

Abstract

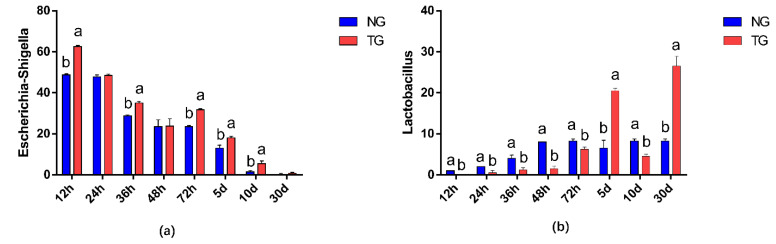
Calf diarrhea caused by pathogenic Escherichia coli is a major cause of death in calves, with a mortality rate of over 50%. It is crucial to understand the pathogenesis and development of calf diarrhea for its prevention and treatment. We aimed to study the effect of pathogenic E. coli on the flora composition, function, and short-chain fatty acid (SCFA) content of calf feces using a calf diarrhea model. Sixty-four newborn Holstein calves (40-43 kg) were divided into a normal group (NG; n = 32) and a test group (TG; n = 32). At the beginning of the experiment, the TG were orally administered pathogenic E. coli O1 (2.5 × 10¹¹ CFU/mL, 100 mL) to establish a calf diarrhea model, and the NG were orally administered the same amount of physiological saline solution. The calves of the two groups were subjected to the same feeding and management. Fresh feces samples were collected at different time points and subjected to 16S rRNA high-throughput sequencing and gas chromatography-mass spectrometry to determine the fecal microbial composition and SCFA content. Pathogenic E. coli O1 significantly altered microbiotas composition in the feces of calves, increasing the relative abundance of Proteobacteria and decreasing that of Firmicutes. It also led to a significant increase in the relative abundance of Escherichia-Shigella and a decrease in Lactobacillus, as well as significantly decreased SCFA content. Therefore, we postulate that pathogenic E. coli induces calf diarrhea by causing intestinal florae imbalance and reducing the content of SCFA.

Keywords: calf; diarrhea; intestinal florae; pathogenic Escherichia coli O1; short-chain fatty acids.


Conflict of interest statement

The authors declare no conflict of interest.

Figures

Figure 1
Figure 1
Abundance of the different phyla (%) in fecal florae. N: Normal group (NG); T: Test group (TG). Numbers 1–8 represent the sampling times of 12 h, 24 h, 36 h, 48 h, 72 h, 5 d, 10 d, and 30 d, respectively. Time relative to start of the study.
Figure 2
Figure 2
Abundance of the different phyla (%) in calf rectal flora. ‘*’ indicates a significant difference. NG: Normal group; TG: Test group; 12 h, 24 h, 36 h, 48 h, 72 h, 5 d, 10 d, and 30 d, represent the sampling times, respectively. Time relative to start of the study.
Figure 3
Figure 3
Abundance of different genera (%) in calf rectal flora. N: Normal group (NG); T: Test group (TG). Numbers 1–8 represent the sampling times of 12 h, 24 h, 36 h, 48 h, 72 h, 5 d, 10 d, and 30 d, respectively. Time relative to start of the study.
Figure 4
Figure 4
Abundance of different genera (%) in calf rectal flora. The different letters indicate significant differences. NG: Normal group; TG: Test group; 12 h, 24 h, 36 h, 48 h, 72 h, 5 d, 10 d, and 30 d, represent the sampling times, respectively. Time relative to start of the study. Error bars indicate SD.
Figure 5
Figure 5
Cluster of Orthologous Groups (COG) function classification column diagram.
Figure 6
Figure 6
Kyoto Encyclopedia of Genes and Genomes (KEGG) metabolic pathway analysis. NG: Normal group; TG: Test group. The error bars indicate positive and negative deviations.
Figure 7
Figure 7
Comparison column chart of SCFA differences: (a) acetic acid; (b) propionic acid; (c) butyric acid; (d) total acid. The units for the measures of the SCFAs are mmol/kg. * 0.01< p ≤ 0.05, ** 0.001 < p ≤ 0.01, *** p ≤ 0.001. NG: Normal group; TG: Test group; 12 h, 24 h, 36 h, 48 h, 72 h, 5 d, 10 d, and 30 d represent the sampling times, respectively. Time relative to start of the study.
Figure 8
Figure 8
Heat map of correlation analysis between rectal microorganisms and short-chain fatty acids. * 0.01 < p ≤ 0.05, ** 0.001 < p ≤ 0.01, *** p ≤ 0.001.

References

    1. Azizzadeh M., Shooroki H.F., Kamalabadi A.S., Stevenson M.A. Factors Affecting Calf Mortality in Iranian Holstein Dairy Herds. Prev. Vet. Med. 2012;104:335–340. doi: 10.1016/j.prevetmed.2011.12.007. - DOI - PubMed
    1. Maria T., Ann L., Hallén S.C., Persson W.K., Mats T., Catarina S. Risk Factors for Calf Mortality in Large Swedish Dairy Herds. Prev. Vet. Med. 2011;99:136–147. - PMC - PubMed
    1. Fumi K., Tomohiro O., Satoru K., Junko K., Yamato S., Kei W., Otgontuya G., Shinya G., Hayato N., Honami S., et al. Direct Evidence of the Preventive Effect of Milk Replacer-Based Probiotic Feeding in Calves against Severe Diarrhea. Vet. Microbiol. 2021;254:108976. - PubMed
    1. Alomari M., Dec M., Nowaczek A., Puchalski A., Urban-Chmiel R. Therapeutic and prophylactic effect of the experimental bacteriophage treatment to control diarrhea caused by E. coli in newborn calves. ACS Infect. Dis. 2021;7:2093–2101. doi: 10.1021/acsinfecdis.1c00010. - DOI - PMC - PubMed
    1. Qin J., Li R., Raes J., Arumugam M., Burgdorf K.S., Manichanh C. A human gut microbial gene catalogue established by metagenomic sequencing. Nature. 2010;464:59–65. doi: 10.1038/nature08821. - DOI - PMC - PubMed

LinkOut - more resources