Review
. 2022 Apr 7;14(8):1861.
doi: 10.3390/cancers14081861.

Cutting-Edge Platforms for Analysis of Immune Cells in the Hepatic Microenvironment-Focus on Tumor-Associated Macrophages in Hepatocellular Carcinoma

Affiliations
Review

Cutting-Edge Platforms for Analysis of Immune Cells in the Hepatic Microenvironment-Focus on Tumor-Associated Macrophages in Hepatocellular Carcinoma

Daniel E Millian et al. Cancers (Basel). .

Abstract

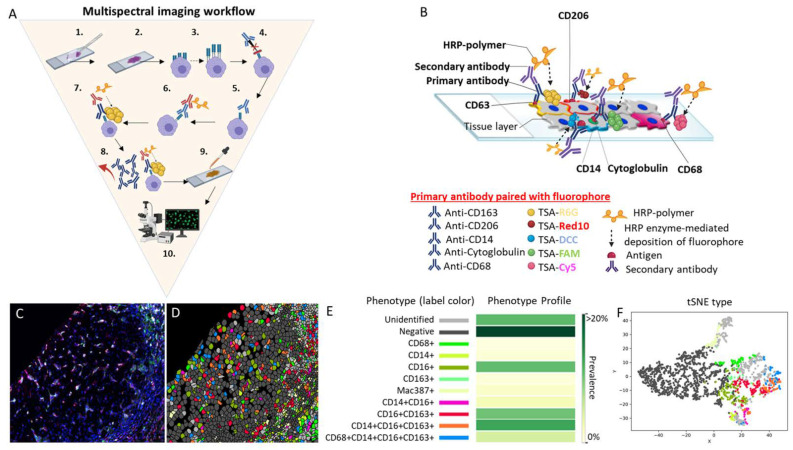
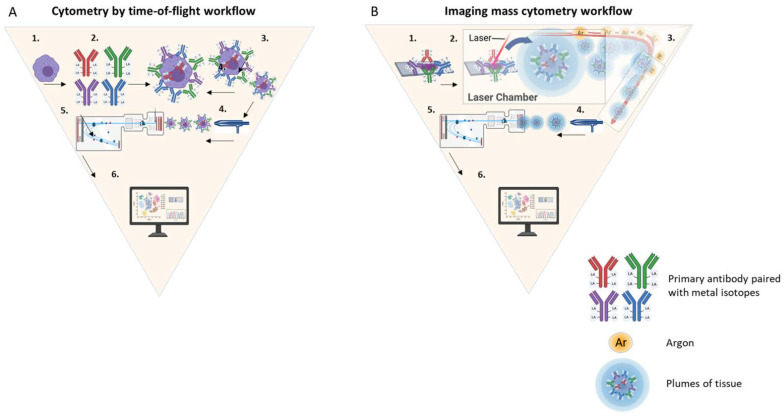
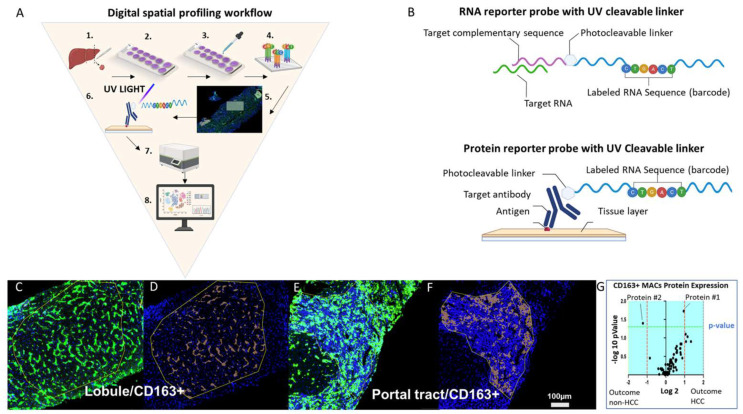
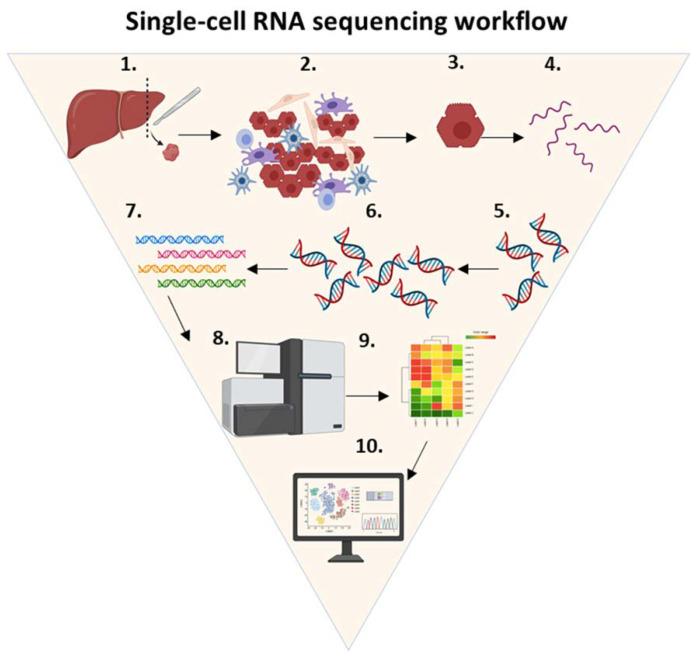
The role of tumor-associated macrophages (TAMs) in the pathogenesis of hepatocellular carcinoma (HCC) is poorly understood. Most studies rely on platforms that remove intrahepatic macrophages from the microenvironment prior to evaluation. Cell isolation causes activation and phenotypic changes that may not represent their actual biology and function in situ. State-of-the-art methods provides new strategies to study TAMs without losing the context of tissue architecture and spatial relationship with neighboring cells. These technologies, such as multispectral imaging (e.g., Vectra Polaris), mass cytometry by time-of-flight (e.g., Fluidigm CyTOF), cycling of fluorochromes (e.g., Akoya Biosciences CODEX/PhenoCycler-Fusion, Bruker Canopy, Lunaphore Comet, and CyCIF) and digital spatial profiling or transcriptomics (e.g., GeoMx or Visium, Vizgen Merscope) are being utilized to accurately assess the complex cellular network within the tissue microenvironment. In cancer research, these platforms enable characterization of immune cell phenotypes and expression of potential therapeutic targets, such as PDL-1 and CTLA-4. Newer spatial profiling platforms allow for detection of numerous protein targets, in combination with whole transcriptome analysis, in a single liver biopsy tissue section. Macrophages can also be specifically targeted and analyzed, enabling quantification of both protein and gene expression within specific cell phenotypes, including TAMs. This review describes the workflow of each platform, summarizes recent research using these approaches, and explains the advantages and limitations of each.

Keywords: CyTOF; HCC; TAMs; TME; cancer; hepatic microenvironment; liver; macrophages; scRNA-seq; spatial genomics; spectral imaging.


Conflict of interest statement

The authors declare no conflict of interest.

Figures

Figure 1
Figure 1
Multispectral imaging workflow. (A) MSI consists of the following 10 steps: (1) deparaffinization of the tissue slide, (2) slide fixation, (3) antigen retrieval, (4) addition of a blocking reagent to prevent non-specific binding of antibodies to tissue or to Fc receptors, (5) incubation and binding of an unmodified primary antibody to its target, (6) HRP-conjugated secondary antibody incubation and binding of the HRP-conjugated antibody to the primary antibody, (7) HRP enzyme-mediated in situ deposition of the tyramine-fluorophore that covalently binds to the tissue near the target, (8) antibody removal, (9) counterstaining of the tissue with DAPI, and (10) mounting of the slide and visualization using fluorescent microscopy. Note that, after step 8, steps 3 to 8 are repeated one to four additional times or until the maximum number of antibodies (five for multiplex) is reached. (B) This is a representative image of a 5-plex stained slide with the membrane antibodies CD163 paired with the fluorophore TSA-Rhodamine 6G (gold), CD206 paired with the fluorophore TSA-Red 10 (red), and CD14 paired with the fluorophore TSA-DCC 10 (aqua blue). A nuclear marker is represented by the antibody anti-cytoglobulin paired with the fluorophore TSA-FAM (green). The cytoplasmic marker is represented by CD68 paired with the fluorophore TSA-Cy5 (violet). In the figure, all five antibodies are shown binding to the tissue at the same time to illustrate how different fluorophores signals are produce simultaneously in situ. However, the antibodies do not remain bound to the tissue after step 8. Only the fluorophores are attached to the tissue after step 8, as they form a covalent bond in the vicinity where the antibody was previously bound to the antigen, amplifying the signal that is acquired by the IF microscope. (C) We stained a representative human liver biopsy slide from a patient with NASH and advanced fibrosis with a multiplex macrophage panel: CD68 (green-Opal 520), CD14 (Magenta-Opal 540), CD16 (red-Opal 620), CD163 (cyan-Opal 650), MAC387 (white-Opal 690), and nuclear stain (Blue-DAPI). A single 20× fluorescence image was obtained after spectral unmixing was applied. (D) Single multiplex images from Figure 1C were used to export multicomponent TIFF files for Visiopharm analysis. A phenotyping application was used to determine the number of different cellular phenotypes present in each image. Each colored dot represents a unique cellular phenotype. Dark gray dots represent cells that were negative for all the markers in the multiplex panel. (E) The same exported multicomponent TIFF files used in Figure 1D were used by the Visiopharm phenotype matrix algorithms to determine the different cellular phenotypes present in each of the 20× multiplex images. The colors shown for each of the different phenotypes correlate with the various colored dots (i.e., individual cells) shown in the multiplex image from Figure 1D. Dark green and white boxes indicate the populations with the highest and lowest prevalence, respectively. (F) t-SNE plots highlight the unique patterns of concatenated cellular markers that are present in the image. This algorithm uses nonlinear dimensional reduction to allow visualization of high dimensional data sets. Cells with similar properties appear closer together and those that are dissimilar appear farther apart in the 2-dimensional map. Abbreviations: 1st Ab, primary antibody; 2nd Ab, secondary antibody; Ab, antibody; DAPI, 4′,6-diamidino-2-phenylindole; HRP, horseradish peroxidase; TSA, tyramine signal amplifier.
Figure 2
Figure 2
Cytometry by time-of-flight workflow. (A) Suspension CyTOF consists of the following steps: (1) cells are selected, (2) antibodies are conjugated with a transition element isotope, (3) the cells are incubated with the antibodies conjugated with a transition element isotope, (4) the cells with an epitope-specific antibody conjugated to a transition element isotope reporter are vaporized, (5) vaporized cells enter the time-of-flight analyzer, where the isotopes are quantified, and (6) data are analyzed by a computer software. (B) Imaging mass cytometry consists of the following steps: (1) tissue is labeled with a pre-selected panel of antibodies conjugated with stable isotopes, (2) the tissue is inserted into an ablation chamber and a camera (not shown) acquires images from the tissue slide, (3) the laser beam ablates a spot of tissue stained with the metal-tagged antibodies, forming aerosol plumes, (4) plumes of tissue matter are directed by a flow of inert gas (Argon) into a coupling tube that delivers them to an inductively coupled plasma ion source, where they are vaporized, atomized, and ionized, (5) the metal-isotope ion cloud passes into the TOF mass spectrometer for analysis of isotope abundance, and (6) data are analyzed using computer software. Abbreviations: Ab, antibody; Ar, argon.
Figure 3
Figure 3
Digital spatial profiling workflow (A) The workflow involves these steps: (1) tissue of interest is biopsied (e.g., liver), (2) tissue is sectioned and fixed to a positively charged glass slide, (3) the slide is stained with up to four morphology markers and a nuclear stain, (4) probes are incubated with the tissue; (5) regions of interest (ROIs) are selected after incubation; (6) target-specific barcodes are liberated by the ultraviolet laser from the selected ROIs, (7) targets are quantified by the nCounter platform, and (8) data are analyzed using a combination of imaging analysis software and R scripts, several of which are provided by the company. (B) The top image represents an RNA probe that is composed of a target complementary sequence conjugated with a photocleavable linker that bonds oligonucleotide RNA sequence barcode. The bottom image represents a protein probe that is composed of a target antibody conjugated with a photocleavable linker that bonds an oligonucleotide RNA sequence barcode. (C) Representative image of a ROI within the liver lobule and (D) represents the respective CD163+ tissue segmentation. (E) Representative image of a ROI within the portal tract and (F) represents the respective CD163+ tissue segmentation. (G) Example of a volcano plot showing enriched liver protein expression by CD163+ macrophages in the liver lobule of HCV+ patients with cirrhosis who did and did not develop HCC. The plot was generated by probing protein expression from a liver biopsy. Abbreviations: Ab, antibody; ROI, region of interest; UV, ultraviolet. Scale bar = 100 µm.
Figure 4
Figure 4
Single-cell RNA sequencing workflow. ScRNA-seq is a technique that consists of the following steps: (1) tissue of interest is selected (e.g., liver), (2) the tissue is dissociated using enzymatic digestion, (3) isolated single cells are lysed, (4) RNA molecules of interest are purified and extracted from the total single-cell RNA, (5) a reverse transcription reaction is used to convert single-stranded RNA into complementary DNA, (6) complementary DNA is amplified using real-time polymerase chain reaction, (7) RNA-seq libraries are created by adding adapters and barcodes, (8) DNA is sequenced using a next generation sequencing platform, (9) the data generated by the NGS are trimmed, filtered and analyzed by computer software algorithms to yield single-cell expression profiles, and (10) cells are mapped to specific phenotypes and subpopulations of rare cell types. Abbreviations: cDNA, complementary DNA.

References

    1. Villanueva A. Hepatocellular Carcinoma. N. Engl. J. Med. 2019;380:1450–1462. doi: 10.1056/NEJMra1713263. - DOI - PubMed
    1. Kim E., Viatour P. Hepatocellular carcinoma: Old friends and new tricks. Exp. Mol. Med. 2020;52:1898–1907. doi: 10.1038/s12276-020-00527-1. - DOI - PMC - PubMed
    1. Poczobutt J.M., De S., Yadav V.K., Nguyen T.T., Li H., Sippel T.R., Weiser-Evans M.C., Nemenoff R.A. Expression Profiling of Macrophages Reveals Multiple Populations with Distinct Biological Roles in an Immunocompetent Orthotopic Model of Lung Cancer. J. Immunol. 2016;196:2847–2859. doi: 10.4049/jimmunol.1502364. - DOI - PMC - PubMed
    1. Tian Z., Hou X., Liu W., Han Z., Wei L. Macrophages and hepatocellular carcinoma. Cell Biosci. 2019;9:79. doi: 10.1186/s13578-019-0342-7. - DOI - PMC - PubMed
    1. Huang Y., Ge W., Zhou J., Gao B., Qian X., Wang W. The Role of Tumor Associated Macrophages in Hepatocellular Carcinoma. J. Cancer. 2021;12:1284–1294. doi: 10.7150/jca.51346. - DOI - PMC - PubMed