. 2022 Apr 8;14(8):1878.
doi: 10.3390/cancers14081878.

Suppression of the ABCA1 Cholesterol Transporter Impairs the Growth and Migration of Epithelial Ovarian Cancer

Affiliations

Suppression of the ABCA1 Cholesterol Transporter Impairs the Growth and Migration of Epithelial Ovarian Cancer

Jixuan Gao et al. Cancers (Basel). .

Abstract

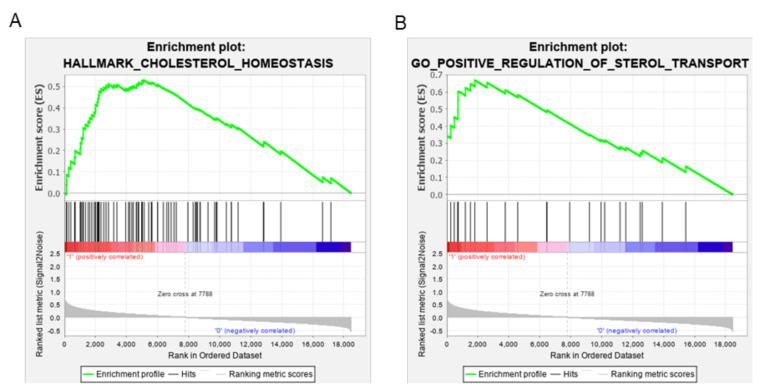
Background: Epithelial ovarian cancer (EOC) is the most lethal gynaecological malignancy with over 80% of cases already disseminated at diagnosis and facing a dismal five-year survival rate of 35%. EOC cells often spread to the greater omentum where they take-up cholesterol. Excessive amounts of cholesterol can be cytocidal, suggesting that cholesterol efflux through transporters may be important to maintain homeostasis, and this may explain the observation that high expression of the ATP-binding cassette A1 (ABCA1) cholesterol transporter has been associated with poor outcome in EOC patients.

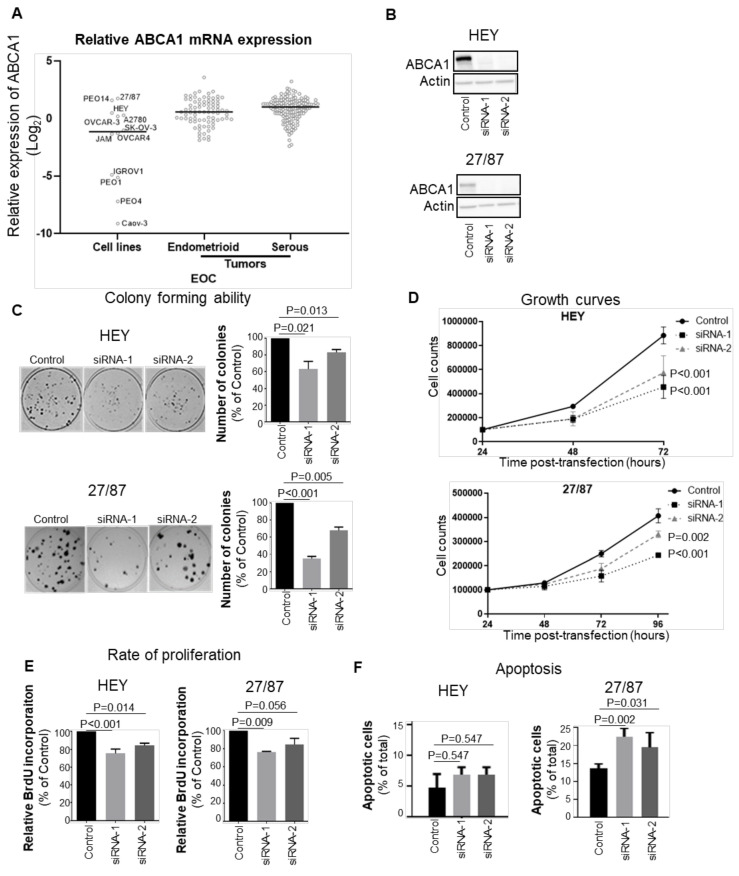
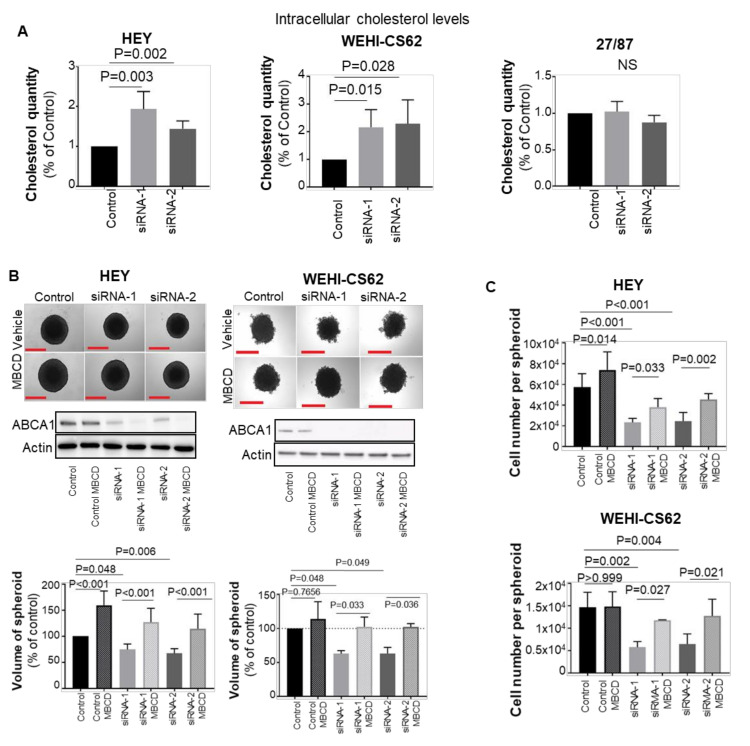
Methods: ABCA1 expression was silenced in EOC cells to investigate the effect of inhibiting cholesterol efflux on EOC biology through growth and migration assays, three-dimensional spheroid culture and cholesterol quantification.

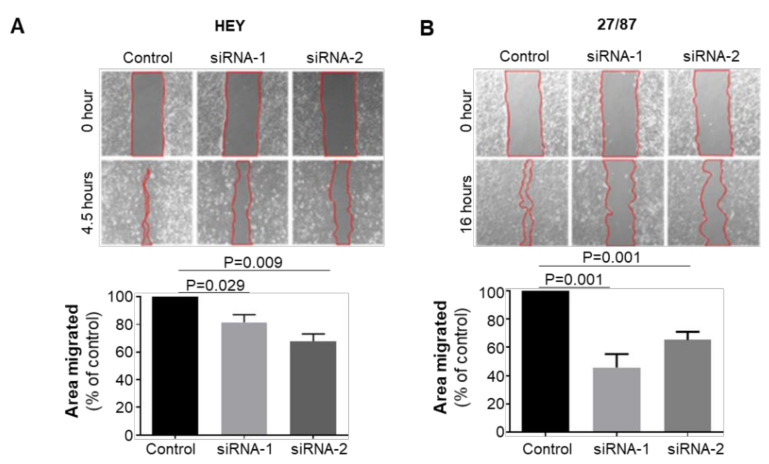
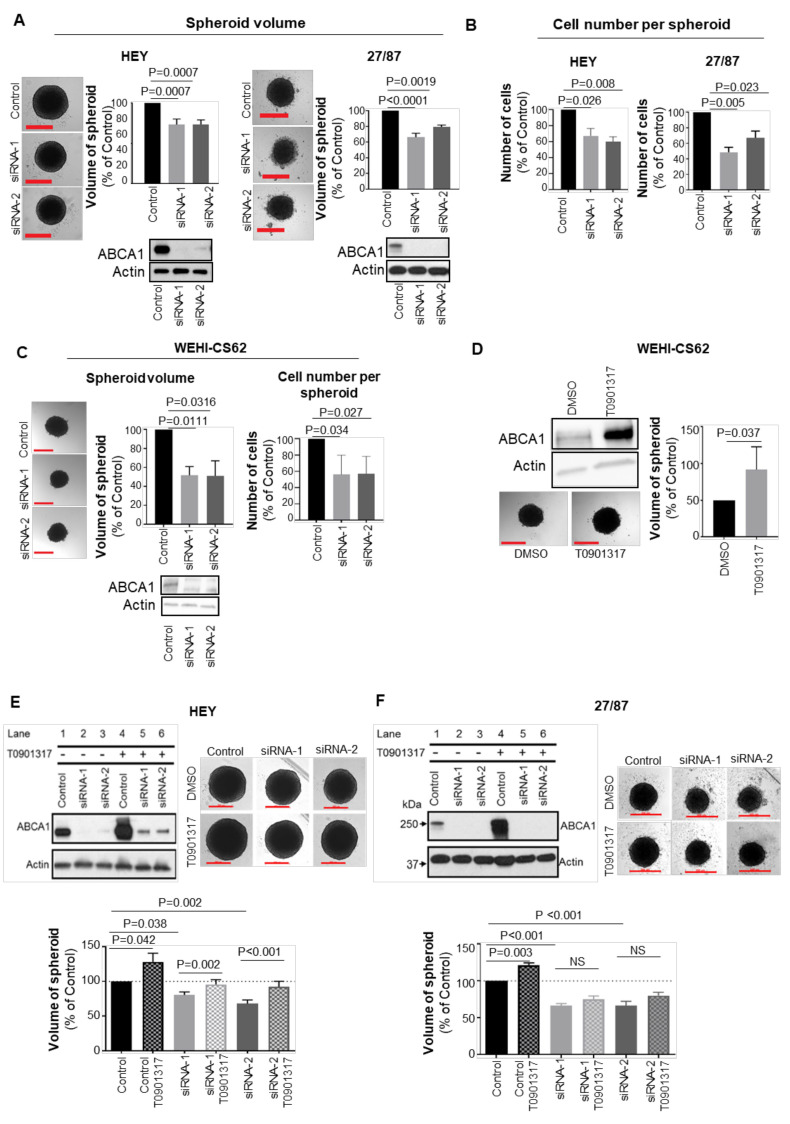
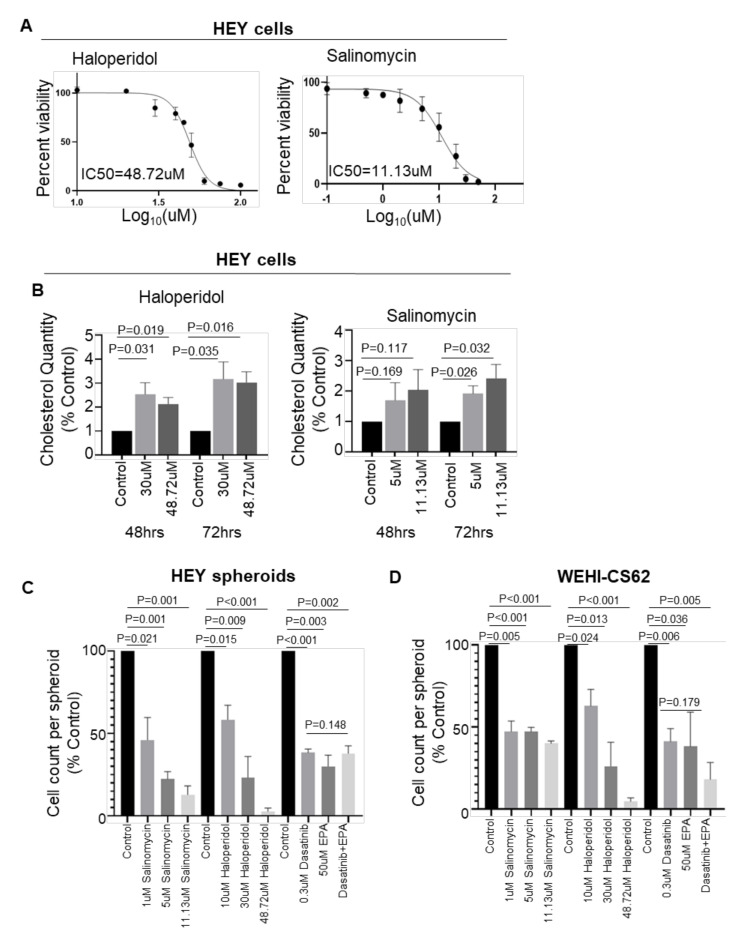
Results: ABCA1 suppression significantly reduced the growth, motility and colony formation of EOC cell lines as well as the size of EOC spheroids, whilst stimulating expression of ABCA1 reversed these effects. In serous EOC cells, ABCA1 suppression induced accumulation of cholesterol. Lowering cholesterol levels using methyl-B-cyclodextrin rescued the effect of ABCA1 suppression, restoring EOC growth. Furthermore, we identified FDA-approved agents that induced cholesterol accumulation and elicited cytocidal effects in EOC cells.

Conclusions: Our data demonstrate the importance of ABCA1 in maintaining cholesterol balance and malignant properties in EOC cells, highlighting its potential as a therapeutic target for this disease.

Keywords: ABCA1; cholesterol; epithelial ovarian cancer.


Conflict of interest statement

The authors declare no conflict of interest. The funders had no role in the design of the study; in the collection, analyses, or interpretation of data; in the writing of the manuscript, or in the decision to publish the results.

Figures

Figure 1
Figure 1
ABCA1 is required for rapid growth of epithelial ovarian cancer (EOC) cells in monolayer. (A) RT-qPCR assessment of ABCA1 expression across a panel of cell lines and ovarian cancer tumours. ABCA1 mRNA expression was normalized to the control genes, GUSB and HPRT, and graphed relative to ABCA1 expression in PEO4. Black represents the median ABCA1 expression of the group. (B) Western blots showing the extent of the knockdown of ABCA1 by two independent siRNAs in the serous HEY and endometrioid 27/87 cell lines. (C) Suppression of ABCA1 impaired the colony forming ability of EOC cells. n = 3. p-Values were derived from one-sample t-tests. (D) ABCA1 knockdown reduced the growth of EOC cells, determined by cell counting. n ≥ 3. p-Values were derived from to-way ANOVA with Dunnett’s multiple comparison tests. (E) ABCA1 knockdown by siRNA-1 and siRNA-2 reduced the rate of EOC cell proliferation. n = 4 for HEY, n = 3 for 27/87. p-Values were derived from one-sample t-tests. (F) ABCA1 knockdown by siRNA-1 and siRNA-2 increased apoptosis in the 27/87 cells as measured by Annexin V and propidium iodide staining. n = 3. p-Values were derived from two-way ANOVA with Dunnett’s multiple comparison test. All results represent the mean ± standard deviation (SD).
Figure 2
Figure 2
ABCA1 supported the migration of epithelial ovarian cancer cells. Wound healing assays performed on (A) HEY and (B) 27/87 EOC cells with or without ABCA1 suppression. Changes in relative wound size was expressed as a percentage of control. n = 3 (A), n = 4 (B). Results represent the mean ± SD. p-Values were derived from one-sample t-tests.
Figure 3
Figure 3
ABCA1 suppression reduced the size of epithelial ovarian cancer (EOC) spheroids. (A) Representative photographs (left panels) and column graphs (right panels) showing the effect of ABCA1 suppression on the size of HEY and 27/87 EOC spheroids at 72 h after seeding into low-adhesion plates and 96 h after transfection. n = 3. p-Values were derived from one-sample t-tests. (B) Changes in the number of cells per spheroid after ABCA1 suppression in HEY and 27/87 cells. Assays performed at the same time as for (A). n = 3. p-Values were derived from one-sample t-tests. (C) Representative photographs (left panels) and column graphs (right panels) showing the effect of ABCA1 suppression on the size of WEHI-CS62 patient-derived, high-grade serous EOC spheroids at 72 h after seeding into low-adhesion plates and 96 hours after transfection. n = 3. p-Values were derived from one-sample t-tests. (D) The effect of ABCA1 overexpression, achieved using T0901317, on WEHI-CS62 spheroid size. n = 3. p-Values were derived from unpaired, two-tailed t-tests. (E) The effect of ABCA1 re-expression, achieved using T0901317, on HEY spheroid size. n = 3. (F) The effect of ABCA1 re-expression, achieved using T0901317, on 27/87 spheroid size. n = 3. All results represent the mean ± SD. p-Values derived from one-way ANOVA with Dunnett’s multiple comparison tests. Scale bars represent 500 µm.
Figure 4
Figure 4
Gene set enrichment analysis (GSEA) showing EOC tumours with high ABCA1 are enriched for expression of gene sets associated with cholesterol metabolism. (A) GSEA showing enrichment in the Hallmark gene set involved in cholesterol homeostasis. p = 0.008 and false discovery rate (FDR) = 0.021. (B) GSEA showing enrichment in the Gene Ontology (GO) gene set involved in positive regulation of sterol transport. p < 0.001 and FDR = 0.069. n = 498.
Figure 5
Figure 5
ABCA1 suppression induced cholesterol accumulation in serous ovarian cancer cells which was associated with decreased growth in the EOC cells. (A) Changes in intracellular cholesterol levels following ABCA1 suppression. n = 5 for serous HEY and WEHI-CS62 cells. n = 3 for endometrioid 27/87 cells. (B) Cholesterol depletion using methyl-B-cyclodextrin (MBCD) reversed the effect of ABCA1 suppression on 3D growth characteristics of HEY (upper panels) and WEHI-CS62 (lower panels). Experiments were performed at 144 h in 3D culture or 168 h after transfection for HEY and 72 h in 3D culture or 96 h after transfection for WEHI-CS62. n = 5 for HEY and n = 3 for WEHI-CS62 cells. (C) Changes in the number of cells per spheroid after ABCA1 suppression with or without MBCD treatment performed at same time points as for (B). n = 5 for HEY and n = 3 for WEHI-CS62 cells. All results represent mean ± SD. p-Values for (A) were derived from one-sample t-test, whilst all other p-values were derived from two-way ANOVA with Tukey’s multiple comparison tests. Scale bars represent 500 µm.
Figure 6
Figure 6
The effect of agents reported to induce cholesterol accumulation on EOC spheroid formation and cell growth. (A) Dose–response curves generated by resazurin-based assays showing the half maximal inhibitory concentrations (IC50) of haloperidol and salinomycin upon malignant serous EOC HEY cells after 72 h treatment. Cells were cultured in monolayer conditions. Percent viability is the viability of the drug-treated cells expressed as a percentage of the viability of DMSO-treated cells. (B) Cholesterol quantification after 48–72 h showing the effect of salinomycin and haloperidol in HEY cells. Cells were cultured in monolayer conditions. (C) Column graphs represent changes in the cell number per spheroid formed by HEY cells after 72 h treatment with vehicle or one of the indicated drugs. (D) Column graphs represent changes in the cell number per spheroid formed by the WEHI-CS62 cells after treatment with vehicle or one of the indicated drugs. n = 3 for all experiments. p-Values for (BD) were derived from one-sample t-tests with the exception of cell count comparisons between the dasatinib and EPA combination with single agents alone for which one-way ANOVA with Dunnett’s multiple comparison tests were performed. Results represent the mean ± SD.

References

    1. Chandra A., Pius C., Nabeel M., Nair M., Vishwanatha J., Ahmad S., Basha R. Ovarian cancer: Current status and strategies for improving therapeutic outcomes. Cancer Med. 2019;8:7018–7031. doi: 10.1002/cam4.2560. - DOI - PMC - PubMed
    1. McCluggage W.G. Morphological subtypes of ovarian carcinoma: A review with emphasis on new developments and pathogenesis. Pathology. 2011;43:420–432. doi: 10.1097/PAT.0b013e328348a6e7. - DOI - PubMed
    1. Matulonis U.A., Sood A.K., Fallowfield L., Howitt B.E., Sehouli J., Karlan B.Y. Ovarian cancer. Nat. Rev. Dis. Primers. 2016;2:16061. doi: 10.1038/nrdp.2016.61. - DOI - PMC - PubMed
    1. Giusti I., Bianchi S., Nottola S.A., Macchiarelli G., Dolo V. Clinical electron microscopy in the study of human ovarian tissues. EMBJ. 2019;14:145–151.
    1. Coleman R.L., Monk B.J., Sood A.K., Herzog T.J. Latest research and treatment of advanced-stage epithelial ovarian cancer. Nat. Rev. Clin. Oncol. 2013;10:211–224. doi: 10.1038/nrclinonc.2013.5. - DOI - PMC - PubMed

LinkOut - more resources