. 2022 Apr 9;14(8):1897.
doi: 10.3390/cancers14081897.

Histone Deacetylase Inhibitors Impair Glioblastoma Cell Motility and Proliferation

Affiliations

Histone Deacetylase Inhibitors Impair Glioblastoma Cell Motility and Proliferation

Elena Rampazzo et al. Cancers (Basel). .

Abstract

Despite being subjected to high-dose chemo and radiotherapy, glioblastoma (GBM) patients still encounter almost inevitable relapse, due to the capability of tumor cells to disseminate and invade normal brain tissues. Moreover, the presence of a cancer stem cell (CSC) subpopulation, already demonstrated to better resist and evade treatments, further frustrates potential therapeutic approaches. In this context, we previously demonstrated that GBM is characterized by a tightly-regulated balance between the β-catenin cofactors TCF1 and TCF4, with high levels of TCF4 responsible for sustaining CSC in these tumors; thus, supporting their aggressive features. Since histone deacetylase inhibitors (HDI) have been reported to strongly reduce TCF4 levels in colon cancer cells, we hypothesized that they could also exert a similar therapeutic action in GBM. Here, we treated primary GBM cultures with Trichostatin-A and Vorinostat, demonstrating their ability to strongly suppress the Wnt-dependent pathways; thus, promoting CSC differentiation and concomitantly impairing GBM cell viability and proliferation. More interestingly, analysis of their molecular effects suggested a prominent HDI action against GBM cell motility/migration, which we demonstrated to rely on the inhibition of the RhoA-GTPase and interferon intracellular cascades. Our results suggest HDI as potential therapeutic agents in GBM, through their action on multiple cancer hallmarks.

Keywords: Wnt signaling; cell migration; glioblastoma; histone deacetylase inhibitors; interferon pathway.


Conflict of interest statement

The authors declare no conflict of interest.

Figures
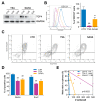
Figure 1
Figure 1
HDI treatment reduces TCF4 levels and impairs CSC phenotype and self-renewal. (A) Western blot analysis displaying TCF4 protein levels upon TSA and SAHA exposure (1–2 μM) for 24 h (HuTuP53). GAPDH was used as loading control. The original Western blot images included in (A) are provided in Supplementary Figure S1A. (B) Representative CD133 surface expression in control and TSA (1 μM)/SAHA (2 μM) treated GBM cells (72 h; HuTuP197) (left) and graph summarizing quantification of CD133+ cells in 3 primary GBM cultures (mean of HuTuP13, 176, and 197) (right). (C,D) Representative contour plots displaying the combined expression of Nestin and Sox2 in HuTuP197 cells after 72 h of treatment with TSA (1 μM) and SAHA (2 μM) (C) and relative quantification of Nestin+ and Sox2+ cells in 3 different cell cultures (mean of HuTuP61, HuTuP176, and HuTuP197) (D). * p < 0.05, ** p < 0.01 by One-way ANOVA multiple comparison test. (E) Limiting dilution assay of GBM cells (HuTuP13) upon short-term exposure (24 h) to HDI (5 μM). Initiating cell frequency of cells in each condition is reported. #: number (F) Western blot analysis displaying the levels of TCF4 expression in pcDNA3.1 and pcDNA3.1-TCF4 (Myc-tagged) transiently transfected GBM cells (HuTuP197). The original Western blot images included in (F) are provided in Supplementary Figure S1D. (G) Bar graph summarizing quantification of CD133+ in GBM cells as in (F), treated with TSA (1 μM) and SAHA (2 μM) for 48 h. * p < 0.05, ** p < 0.01 by paired t test.
Figure 2
Figure 2
HDI affect GBM cell viability/proliferation and synergy with TMZ. (A) Dose-response viability curves of HuTuP13 GBM cells exposed to scalar doses of TSA, SAHA, or TMZ for 72 h. (B) Heatmaps displaying Bliss excess value matrixes of TSA (left) and SAHA (right) response in GBM cells (HuTuP13) when combined with TMZ. SD: standard deviation.
Figure 3
Figure 3
Reduction of GBM cell stemness is not accompanied by acquisition of a differentiated phenotype due to Wnt signaling suppression. (A) Representative immunofluorescence images displaying Nestin (green) and βIII-tubulin (red) expression of HuTuP82 cells after 5-d exposure to TSA (0.2 μM) and SAHA (0.5 μM). Cell nuclei were counterstained with Dapi (blue). Original magnification 10×; bar: 30 μm. (B) Quantification of βIII-tubulin+ cells by immunofluorescence as in (A) (mean of HuTuP82 and HuTuP176 GBM cells). (C) Western blot analysis of indicated proteins extracted from HuTuP61 cells treated for 24 h with TSA (5 μM) and SAHA (5 μM) (upper panel). The original Western blot images included in (C) are provided in Supplementary Figure S3B. Bar graph reporting total protein quantitation (integrated density) by Coomassie staining of WB samples (bottom panel). (D) Bar graph reporting relative luciferase activity of GBM cells (mean of HuTuP15, 61 and 82) transfected with BAT-lux plasmid and then treated for 24 h with HDI (5 μM). A.U.: arbitrary units. * p < 0.05, *** p < 0.001 by One-way ANOVA multiple comparison test.
Figure 4
Figure 4
TSA and SAHA significantly modulate GBM cell transcription. (A) Heatmap displaying hierarchical clustering of control and HDI-treated GBM cells (5 μM for 24 h) according to the top variable transcripts. (B) Dot plot showing significant (FDR q value < 0.05) transcriptional enrichments (C2cp MSigDB) of common DEGs between TSA and SAHA treated cells as in (A). (C) Heatmap displaying relative enrichment of each sample subjected to GEP in the four different GBM molecular subtypes [2] from the C2cgp MSig database.
Figure 5
Figure 5
HDI inhibit proliferation by preventing GBM cells from proceeding in the cell cycle. (A) Representative flow cytometric evaluation of Ki67 in control and TSA (1 μM)/SAHA (2 μM)-treated GBM cells (72 h; HuTuP197) (left) and graph summarizing its quantification in 3 primary GBM cultures (mean of HuTuP13, 192, and 197) (right). (B) Representative flow cytometric evaluation of EdU incorporation in control and HDI treated GBM cells (72 h; HuTuP176) as in (A) (left), and graph summarizing its quantification in 2 primary GBM cultures (mean of HuTuP82 and 176) (right). (C) Bar graph displaying the relative distribution of GBM cells (mean of HuTuP82, 108 and 192) in the G0/G1, S, and G2/M phases of the cell cycle. (D) Representative PI/pHH3 cytofluorimetric staining in GBM cells (HuTuP192). (E) Bar graph displaying mitotic index values in control and HDI-treated GBM cells (mean of HuTuP82 and 176). * p < 0.05, ** p < 0.01, *** p < 0.001, **** p < 0.0001 by one-way ANOVA multiple comparison test.
Figure 6
Figure 6
HDI induce cytoskeletal rearrangements and RhoA-GTPase-dependent inhibition of cell motility/migration. (A) Representative immunofluorescence images of HuTuP82 GBM cells displaying cytoskeletal (phalloidin, green) alterations associated with TSA (1 μM) and SAHA (2 μM) treatments for 72 h. Cell nuclei were counterstained with Dapi (blue). Original magnification 20×; bar: 10 μM. (B) Western blot analysis of proteins (as indicated) extracted from HuTuP61 cells treated for 24 h with TSA (5 μM) and SAHA (5 μM) (upper panel), and bar graph reporting total protein quantitation (integrated density) by Coomassie staining of same samples). The original Western blot images included in (B) are provided in Supplementary Figure S6B. (C,D) Graph representing the normalized (x, y) trajectories of control and HDI-treated (1 μM TSA and 2 μM SAHA) GBM cells moving within the plate in a 16-h timespan (C), and box plot summarizing the total length covered by cells in the same time interval (HuTuP82) (D). *** p < 0.001, **** p < 0.0001 by one-way ANOVA multiple comparison test. (E,F) Representative images demonstrating the inhibitory effect displayed by HDI (1 μM TSA and 2 μM SAHA) on the ability of GBM cells (HuTuP82) to close the wound during a scratch assay (E), and relative quantification of the scratch closure assay performed in the HuTuP61, HuTuP82, and HuTuP176 GBM cells (F). Original magnification 10×; bar: 50 μM.
Figure 7
Figure 7
HDI-induced inhibition of cell motility is partially dependent on IFN target gene suppression. (A) Circle plot representing HDI-induced DEGs contributing to a significant negative enrichment (FDR q value < 0.05) of the transcriptional Hallmarks (Hallmarks gene sets from MSigDB) correlated to the IFN-α/γ and inflammatory responses. (B) Heatmap summarizing the relative expression of a series of IFN/inflammation signaling target genes as indicated when GBM cells (HuTuP61, 176) were exposed to TSA (5 μM), SAHA (5 μM), IFN-γ (1 μg/mL), or a combination of them for 24 h. (C) Box plot summarizing the total length covered by cells (HuTuP61, 82, 176, 192, 197) when treated with TSA (1 μM) and SAHA (2 μM) (combined or not with 1 μg/mL IFN-γ) during a 16-h live imaging experiment. ** p < 0.01, *** p < 0.001, **** p < 0.0001 by t test or one-way ANOVA multiple comparison test.

Similar articles

Cited by

References

    1. Brennan C.W., Verhaak R.G., McKenna A., Campos B., Noushmehr H., Salama S.R., Zheng S., Chakravarty D., Sanborn J.Z., Berman S.H., et al. The somatic genomic landscape of glioblastoma. Cell. 2013;155:462–477. doi: 10.1016/j.cell.2013.09.034. - DOI - PMC - PubMed
    1. Verhaak R.G., Hoadley K.A., Purdom E., Wang V., Qi Y., Wilkerson M.D., Miller C.R., Ding L., Golub T., Mesirov J.P., et al. Integrated genomic analysis identifies clinically relevant subtypes of glioblastoma characterized by abnormalities in PDGFRA, IDH1, EGFR, and NF1. Cancer Cell. 2010;17:98–110. doi: 10.1016/j.ccr.2009.12.020. - DOI - PMC - PubMed
    1. Marenco-Hillembrand L., Wijesekera O., Suarez-Meade P., Mampre D., Jackson C., Peterson J., Trifiletti D., Hammack J., Ortiz K., Lesser E., et al. Trends in glioblastoma: Outcomes over time and type of intervention: A systematic evidence based analysis. J. Neurooncol. 2020;147:297–307. doi: 10.1007/s11060-020-03451-6. - DOI - PubMed
    1. Stupp R., Hegi M.E., Mason W.P., van den Bent M.J., Taphoorn M.J., Janzer R.C., Ludwin S.K., Allgeier A., Fisher B., Belanger K., et al. Effects of radiotherapy with concomitant and adjuvant temozolomide versus radiotherapy alone on survival in glioblastoma in a randomised phase III study: 5-year analysis of the EORTC-NCIC trial. Lancet Oncol. 2009;10:459–466. doi: 10.1016/S1470-2045(09)70025-7. - DOI - PubMed
    1. Chen J., Li Y., Yu T.S., McKay R.M., Burns D.K., Kernie S.G., Parada L.F. A restricted cell population propagates glioblastoma growth after chemotherapy. Nature. 2012;488:522–526. doi: 10.1038/nature11287. - DOI - PMC - PubMed