. 2022 Apr 12;14(8):1946.
doi: 10.3390/cancers14081946.

Elevating SOX2 Downregulates MYC through a SOX2:MYC Signaling Axis and Induces a Slowly Cycling Proliferative State in Human Tumor Cells

Affiliations

Elevating SOX2 Downregulates MYC through a SOX2:MYC Signaling Axis and Induces a Slowly Cycling Proliferative State in Human Tumor Cells

Ethan P Metz et al. Cancers (Basel). .

Abstract

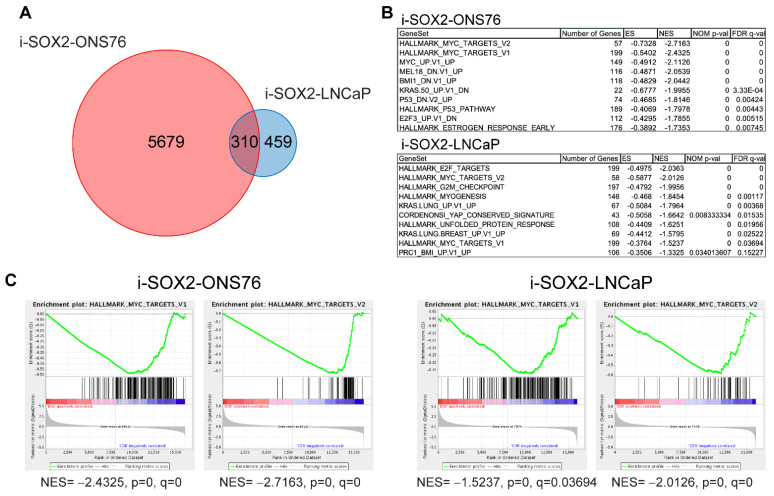
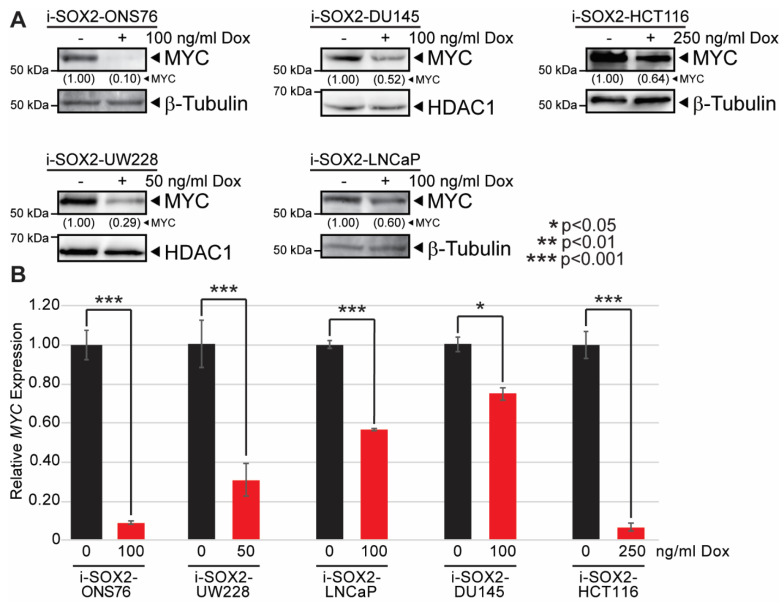
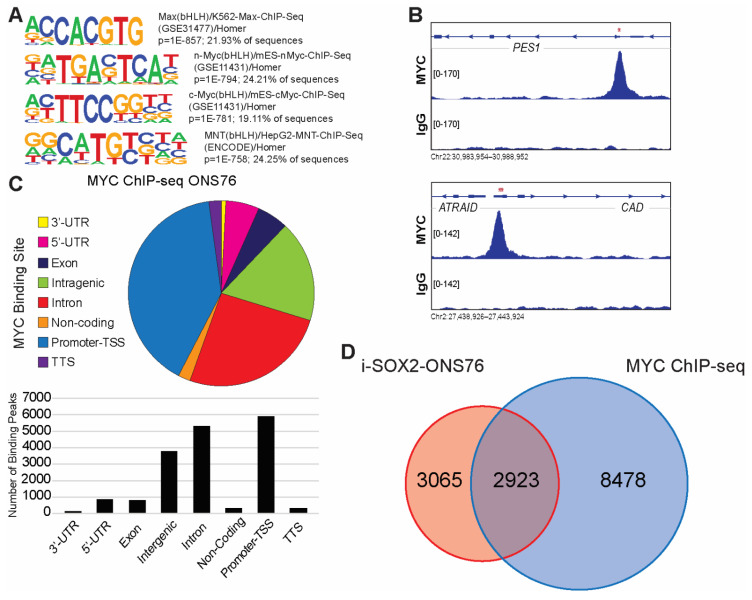
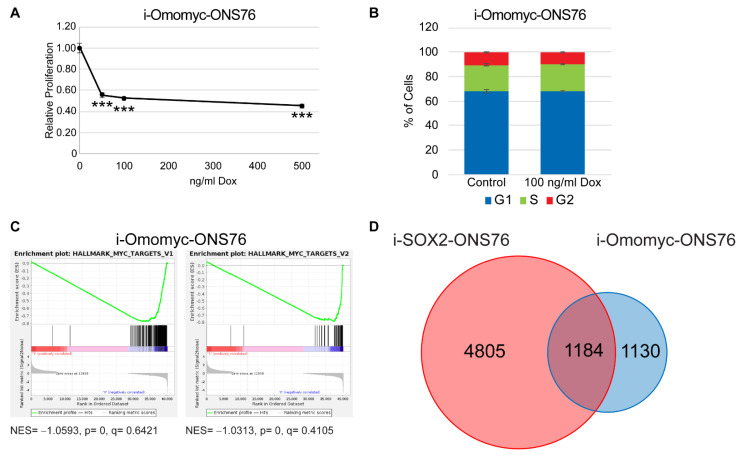
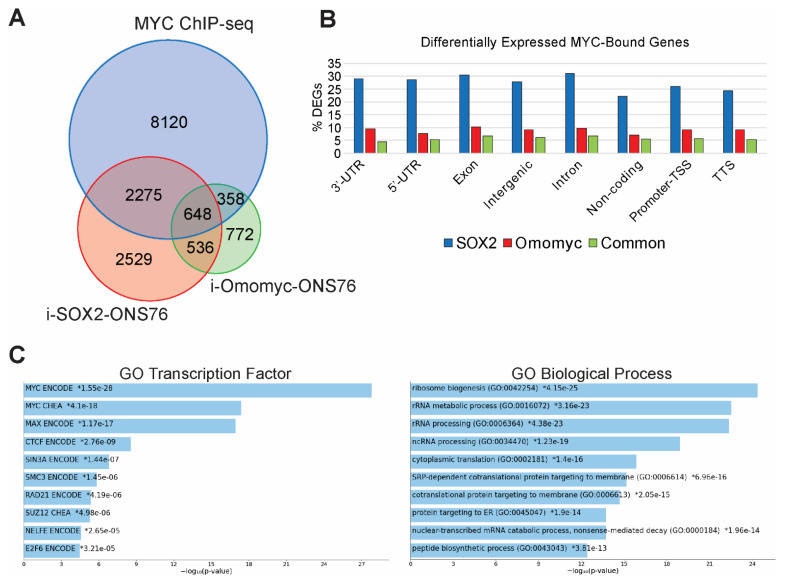
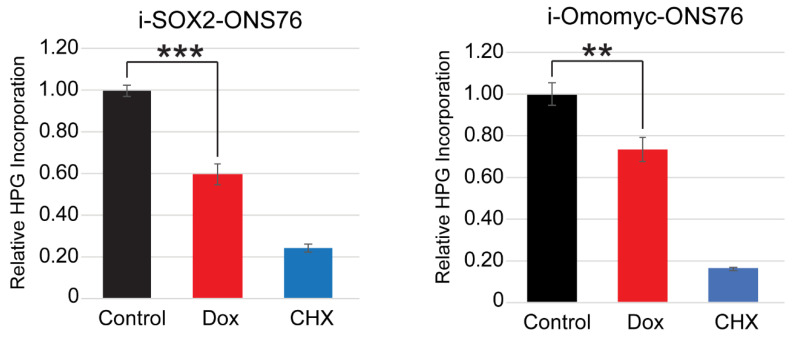
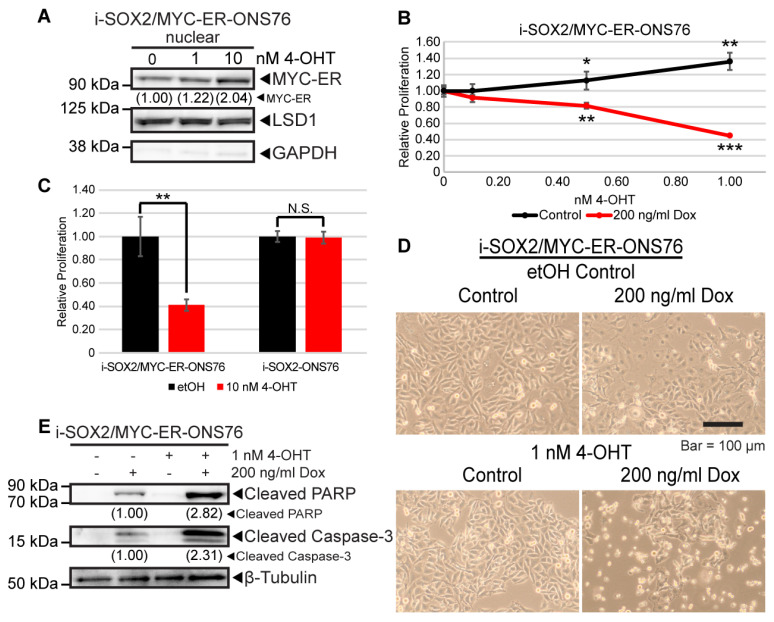
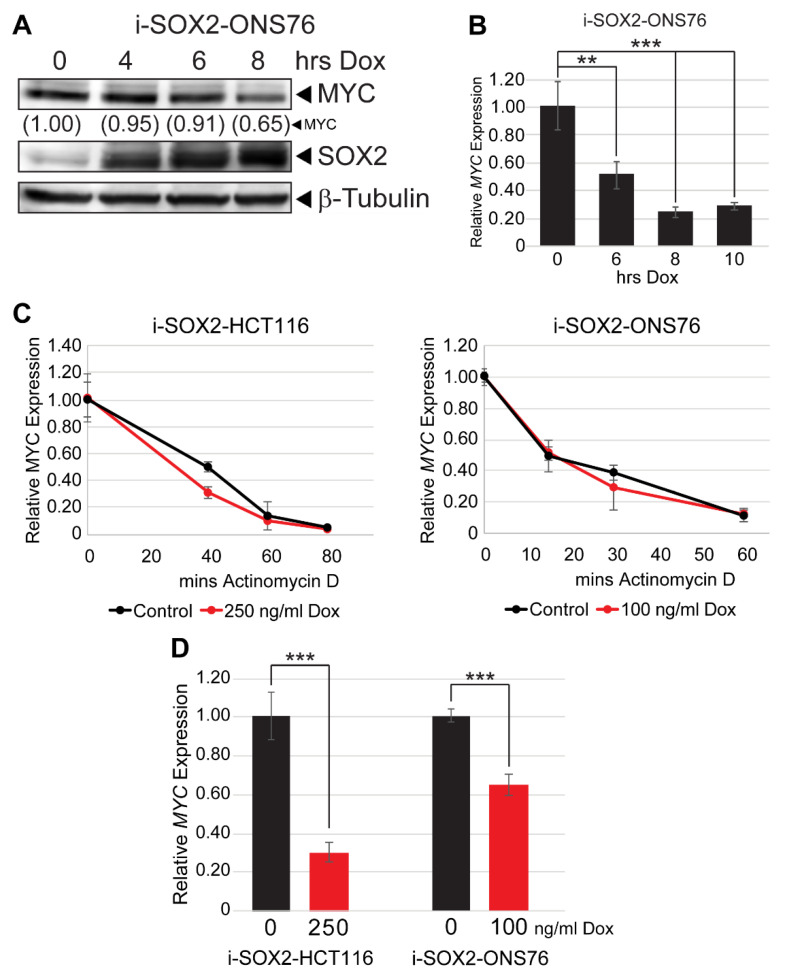
Slowly cycling/infrequently proliferating tumor cells present a clinical challenge due to their ability to evade treatment. Previous studies established that high levels of SOX2 in both fetal and tumor cells restrict cell proliferation and induce a slowly cycling state. However, the mechanisms through which elevated SOX2 levels inhibit tumor cell proliferation have not been identified. To identify common mechanisms through which SOX2 elevation restricts tumor cell proliferation, we initially performed RNA-seq using two diverse tumor cell types. SOX2 elevation in both cell types downregulated MYC target genes. Consistent with these findings, elevating SOX2 in five cell lines representing three different human cancer types decreased MYC expression. Importantly, the expression of a dominant-negative MYC variant, omomyc, recapitulated many of the effects of SOX2 on proliferation, cell cycle, gene expression, and biosynthetic activity. We also demonstrated that rescuing MYC activity in the context of elevated SOX2 induces cell death, indicating that the downregulation of MYC is a critical mechanistic step necessary to maintain survival in the slowly cycling state induced by elevated SOX2. Altogether, our findings uncover a novel SOX2:MYC signaling axis and provide important insights into the molecular mechanisms through which SOX2 elevation induces a slowly cycling proliferative state.

Keywords: MYC (c-MYC); SOX2; colorectal cancer; medulloblastoma; prostate cancer.


Conflict of interest statement

The authors declare no conflict of interest.

Figures

Figure 1
Figure 1
RNA-seq analysis of i-SOX2-ONS76 and i-SOX2-LNCaP cells. (A) Venn diagram of differentially expressed genes (DEGs) between i-SOX2-ONS76 and i-SOX2-LNCaP cells. (B) Top 10 downregulated GSEA gene sets when SOX2 is elevated in i-SOX2-ONS76 and i-SOX2-LNCaP cells. (C) Gene set enrichment plots for MYC target genes in i-SOX2-ONS76 and i-SOX2-LNCaP.
Figure 2
Figure 2
Elevating SOX2 downregulates MYC protein and mRNA in multiple tumor types. (A) Western blot analysis of MYC protein levels in i-SOX2 tumor cell lines after 48 h culture in the presence or absence of Dox at the indicated concentrations. (B) RT-qPCR analysis of MYC mRNA expression in i-SOX2 tumor cell lines after 48 h culture in the presence or absence of Dox at the indicated concentrations. Error bars represent standard deviation. * p < 0.05, *** p < 0.001.
Figure 3
Figure 3
ChIP-seq analysis of MYC binding peaks in ONS76 cells. (A) Motif analysis for MYC-binding sites in ONS76 cells. Significance values and percentage of ChIP-seq peaks containing the motif are indicated. (B) IGV screenshot of representative ChIP-seq peaks for MYC in ONS76 cells. PES1 contains an MYC-binding peak in a promoter/TSS region and CAD is bound near the TTS. Red asterisks indicate the position of E-boxes within the binding peaks. (C) Distribution of MYC binding peaks across regions of associated genes. (D) Venn diagram comparing i-SOX2-ONS76 DEGs and genes with associated MYC binding peaks.
Figure 4
Figure 4
Omomyc induction recapitulates the proliferative and cell cycle effects of elevated SOX2. (A) Proliferation of i-Omomyc-ONS76 cells as determined by MTT assay following 4 days of culture in the presence of Dox at the indicated doses. (B) Cell cycle analysis of i-Omomyc-ONS76 cells was performed by flow cytometry after 4 days of culture in the presence or absence of 100 ng/mL Dox. (C) Gene set enrichment plots for MYC target genes in i-Omomyc-ONS76 cells. (D) Venn diagram comparing i-SOX2-ONS76 DEGs and i-Omomyc-ONS76 DEGs. Error bars represent the standard deviation. *** p < 0.001.
Figure 5
Figure 5
SOX2 and MYC regulate ribosomal biogenesis and protein translation genes in ONS76 cells. (A) Venn diagram showing the overlap of MYC-bound genes in ONS76 cells, i-SOX2-ONS76 DEGs, and i-Omomyc-ONS76 DEGs. (B) Percentage of MYC-bound genes differentially expressed in i-SOX2-ONS76, i-Omomyc-ON76, or both, based on the location of the MYC-binding peak. (C) TOP 10 GO Transcription Factor (ENCODE and CHEA) and Biological Process enrichment categories for common genes bound by MYC and differentially expressed in i-SOX2-ONS76 and i-Omomyc-ONS76 cells.
Figure 6
Figure 6
Elevating SOX2 and omomyc downregulates protein translation in ONS76 cells. Protein translation in i-SOX2-ONS76 and i-Omomyc-ONS76 cells was quantified by the flow cytometry analysis of HPG incorporation after 48 h culture in the presence of the indicated doses of Dox. Error bars represent standard deviations. ** p < 0.01, *** p < 0.001.
Figure 7
Figure 7
Elevated MYC activity in the context of elevated SOX2 induces cell death. (A) Western blot analysis of nuclear extracts from i-SOX2/MYC-ER-ONS76 cells. Extracts were harvested after 48 h in the presence or absence of Dox and 4-OHT. (B) Proliferation of i-SOX2/MYC-ER-ONS76 cells as determined by MTT assay following 4 days of culture in the presence of Dox and 4-OHT at the indicated doses. (C) Proliferation of i-SOX2/MYC-ER-ONS76 and i-SOX2-ONS76 cells was determined by MTT assay following 4 days of culture in the presence or absence of 10 nM 4-OHT. (D) Photomicrographs of i-SOX2/MYC-ER-ONS76 cells after 4 days of culture in the presence or absence of Dox and 4-OHT. (E) Western blot analysis of cleaved PARP and cleaved Caspase-3 using whole cell extracts prepared from cells treated for 48 h in the presence or absence of Dox and 4-OHT at the concentrations indicated. N.S., not significant; * p < 0.05, ** p < 0.01, *** p < 0.001.
Figure 8
Figure 8
SOX2 elevation downregulates MYC transcription. (A) Western blot analysis of MYC protein levels in i-SOX2-ONS76 cells treated with 100 ng/mL Dox for the indicated times. (B) RT-qPCR analysis of MYC mRNA levels in i-SOX2-ONS76 cells treated with 100 ng/mL Dox for the indicated times. Error bars represent standard deviations. (C) RT-qPCR analysis of MYC mRNA levels after 24 h of treatment at the indicated Dox dosage followed by 5 mg/mL actinomycin D treatment for the times indicated. MYC mRNA levels in control and Dox-treated cells were normalized to the 0 actinomycin D time point. (D) NRO-qPCR analysis of i-SOX2-ONS76 and i-SOX2-HCT116 cells. Cells were cultured in the indicated doses of Dox for 24 h before being subjected to NRO-qPCR analysis. Error bars represent standard deviation. ** p < 0.01, *** p < 0.001.

References

    1. Wuebben E.L., Rizzino A. The Dark Side of Sox2: Cancer—A comprehensive overview. Oncotarget. 2017;8:44917–44943. doi: 10.18632/oncotarget.16570. - DOI - PMC - PubMed
    1. Avilion A.A., Nicolis S.K., Pevny L.H., Perez L., Vivian N., Lovell-Badge R. Multipotent cell lineages in early mouse development depend on Sox2 function. Genes Dev. 2003;17:126–140. doi: 10.1101/gad.224503. - DOI - PMC - PubMed
    1. Metz E.P., Rizzino A. Sox2 dosage: A critical determinant in the functions of SOX2 in both normal and tumor cells. J. Cell. Physiol. 2019;234:19298–19306. doi: 10.1002/jcp.28610. - DOI - PMC - PubMed
    1. Chew J.-L., Loh Y.-H., Zhang W., Chen X., Tam W.-L., Yeap L.-S., Li P., Ang Y.-S., Lim B., Robson P., et al. Reciprocal transcriptional regulation of POU5F1 and SOX2 via the oct4/sox2 complex in embryonic stem cells. Mol. Cell. Biol. 2005;25:6031–6046. doi: 10.1128/MCB.25.14.6031-6046.2005. - DOI - PMC - PubMed
    1. Kopp J.L., Ormsbee B.D., Desler M., Rizzino A. Small increases in the level of Sox2 trigger the differentiation of mouse embryonic stem cells. Stem Cells. 2008;26:903–911. doi: 10.1634/stemcells.2007-0951. - DOI - PubMed