. 2022 Apr 13;14(8):1968.
doi: 10.3390/cancers14081968.

Combined Alcohol Exposure and KRAS Mutation in Human Pancreatic Ductal Epithelial Cells Induces Proliferation and Alters Subtype Signatures Determined by Multi-Omics Analysis

Affiliations

Combined Alcohol Exposure and KRAS Mutation in Human Pancreatic Ductal Epithelial Cells Induces Proliferation and Alters Subtype Signatures Determined by Multi-Omics Analysis

Emalie J Clement et al. Cancers (Basel). .

Abstract

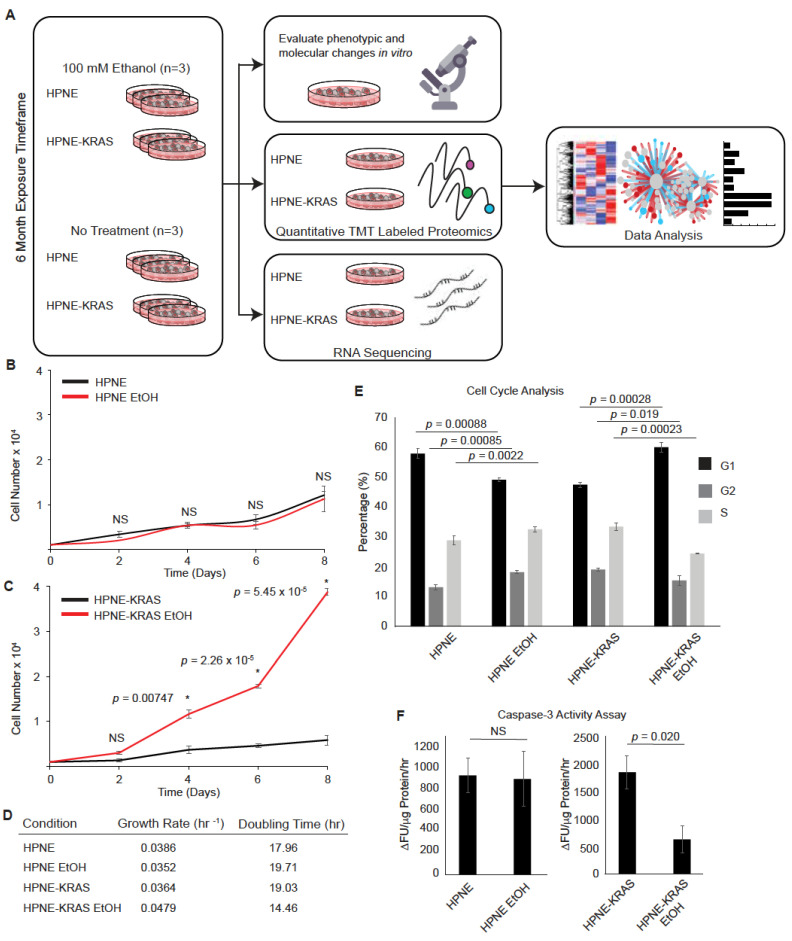
Pancreatic Ductal adenocarcinoma (PDAC) is an aggressive cancer commonly exhibiting KRAS-activating mutations. Alcohol contributes to the risk of developing PDAC in humans, and murine models have shown alcohol consumption in the context of KRAS mutation in the pancreas promotes the development of PDAC. The molecular signatures in pancreas cells altered by alcohol exposure in the context of mutant KRAS could identify pathways related to the etiology of PDAC. In this study, we evaluated the combined effects of alcohol exposure and KRAS mutation status on the transcriptome and proteome of pancreatic HPNE cell models. These analyses identified alterations in transcription and translational processes in mutant KRAS cells exposed to alcohol. In addition, multi-omics analysis suggests an increase in the correlation between mRNA transcript and protein abundance in cells exposed to alcohol with an underlying KRAS mutation. Through differential co-expression, SERPINE1 was found to be influential for PDAC development in the context of mutant KRAS and ethanol. In terms of PDAC subtypes, alcohol conditioning of HPNE cells expressing mutant KRAS decreases the Inflammatory subtype signature and increases the Proliferative and Metabolic signatures, as we previously observed in patient samples. The alterations in molecular subtypes were associated with an increased sensitivity to chemotherapeutic agents gemcitabine, irinotecan, and oxaliplatin. These results provide a framework for distinguishing the molecular dysregulation associated with combined alcohol and mutant KRAS in a pancreatic cell line model.

Keywords: KRAS; Proteomics; SERPINE1; alcohol; pancreatic cancer.


Conflict of interest statement

The authors declare no conflict of interest.

Figures

Figure 1
Figure 1
Ethanol promotes HPNE cell population expansion in a KRAS-dependent manner. (A) Schematic of the study design. RNA-Seq and quantitative proteomics were used to characterize the impact of EtOH conditioning in the context of KRAS mutations in non-transformed pancreatic HPNE cells. (B,C) Cell population growth curves. In total, 1000 cells were plated per well and counted every 2 days over an 8-day period for HPNE (B) and HPNE-KRAS (C) cell lines. Mean ± standard error of the mean (SEM); n = 3; significant p-values determined by Student’s t-test are indicated; NS, not significant; *, p-value ≤ 0.05. (D) Cell population doubling time determined from the cell counting study depicted in (B,C). (E) Cell cycle profiles were determined by PI staining and FACs analysis for the indicated cell lines and treatments. Mean ± SEM; n = 3; p-value determined by Student’s t-test. (F) The steady-state levels of Caspase-3 activity in the indicated cells and treatments represented as the change in fluorescent units per µg whole protein lysate per 1 h reaction time (∆FU/µg protein/hr). Mean ± SEM; n = 3.
Figure 2
Figure 2
EtOH and KRAS status influence gene expression profiles in HPNE cells. (A) Heatmap of transcript expression values measured by RNA-Seq. (n = 1). (B) MA plot showing the log ratio (M) versus the mean expression (A), across all conditions, of transcripts detected by RNA-Seq. (C) Venn diagram of differentially expressed protein coding transcripts. Protein coding transcripts that were ±2-fold different in the EtOH-conditioned cells compared to the untreated controls were considered differentially expressed. (DG) Ethanol-conditioned cell lines were compared to untreated controls to identify up and downregulated protein coding genes (fold change = ±2) for GO term enrichment analysis. The DAVID bioinformatics tool was used to identify enriched terms for up or downregulated genes (analyzed independently). The z-score (x-axis) was calculated by z-score = (up − down)/sq (count), where up and down are the number of assigned genes upregulated or downregulated in the data, and count is the number of genes assigned to a term. The bubble size is representative of the number of genes present in the respective term. FDR was used for the adjusted p-values.
Figure 3
Figure 3
Quantitative proteomic analysis of the impact of EtOH and KRAS mutation in HPNE cells on protein expression. (A) Heatmap of the mean protein expression values for HPNE and HPNE-KRAS cells treated with or without EtOH. n = 3. (B) Principal Components Analysis (PCA) of the proteomics data for HPNE and HPNE-KRAS cells with or without EtOH conditioning. HPNE-2 was removed as an outlier. (C) Volcano plot of protein expression differences between HPNE-KRAS EtOH vs. HPNE-KRAS (−log10 p-value, determined by Student’s t-test). (DG) Ethanol-conditioned cell lines were compared to untreated controls to select up and downregulated proteins (cutoff, fold-change ±1.25) for GO term enrichment analysis for the indicated comparisons. The DAVID bioinformatics tool was used to identify enriched terms for up or downregulated proteins (analyzed independently). The z-score (x-axis) was calculated by z-score = (up − down)/sq (count), where up and down are the number of assigned proteins upregulated or downregulated in the data, and count is the number of proteins assigned to a term. The bubble size is representative of the number of proteins present in the respective term. FDR was used for the adjusted p-values.
Figure 4
Figure 4
The effects of EtOH conditioning on ethanol metabolism in HPNE and HPNE-KRAS cells. (A) Simplified depiction of the ethanol metabolic pathway. Metabolites are in black text; enzymes are in blue circles. (B) Measurement of acetaldehyde abundance with and without acute EtOH exposure for 1 h in both the parental- and EtOH-conditioned HPNE and HPNE-KRAS cell lines. Mean ± SEM; n = 3. (C) Cellular Reactive Oxygen Species (ROS) measurements by DCFDA staining for the indicated cell line and treatment condition. Mean ± SEM; n = 3. (D) Protein expression of ethanol breakdown metabolism enzymes detected by quantitative TMT labeled proteomics. Mean ± SEM; n = 3. p-values were determined by Student’s t-test.
Figure 5
Figure 5
Mutant KRAS cells treated with ethanol display a higher level of transcriptional and translational coordination. (A) Multiple Co-inertia analysis of RNA-Seq and proteomics data. Length of the line connecting the proteomics and RNA-Seq data represents their dissimilarity; RNA-Seq n = 1, proteomics n = 3. (B) Venn diagrams showing differentially expressed protein coding genes (RNA-Seq, ±2-fold change) and proteins (Proteomics, ±1.25-fold change) common in the RNA-Seq and proteomics data. (C) Heatmaps of all conditions showing expression of commonly detected up-(33) and down-(11) regulated protein-coding transcripts (left) and proteins (right) found in HPNE-KRAS EtOH cells compared to HPNE-KRAS cells. (DI). Validation of omics data by qRT-PCR and Western blot for CD81 (D), RHOG (E), ZPR1 (F), RUVBL1 (G), PRPF19 (H), and NT5E (I); indicated in (C) by *. The qRT-PCR was performed to validate RNA-Seq expression with GAPDH used for normalization. Mean ± SEM; n = 4. Western blots were used to validate proteomics expression using HSC70 or GAPDH as loading control. Cluster of Differentiation 81 (CD81); Ras Homolog Family Member G (RHOG); ZPR1 zinc finger (ZPR1); RuvB like AAA ATPase 1 (RUVBL1); Pre-MRNA Processing Factor 19 (PRPF19); 5′-Nucleotidase (NT5E). The original blots of Figure 5 could be found in Figure S5.
Figure 6
Figure 6
Co-expression network analysis identifies SERPINE1 as a highly interconnected protein involved in alcohol-treated and mutant KRAS HPNE cells. (A) Pearson correlation values for each protein–protein pair were determined for HPNE, HPNE EtOH, HPNE-KRAS, and HPNE-KRAS EtOH proteomics expression. Correlations that were ≥ +0.75 in the HPNE-KRAS EtOH and ≤−0.75 in the HPNE, HPNE EtOH, and HPNE-KRAS were considered positive correlations. Correlations that were ≤−0.75 in the HPNE-KRAS EtOH and ≥ +0.75 in the HPNE, HPNE EtOH, and HPNE-KRAS were considered negative correlations. Edges represent the presence of a positive (red) or negative (blue) correlation between connected proteins. Nodes represent proteins that have positive correlations (red), negative correlations (blue), or positive and negative correlations (grey) (n = 3). (B) Positive and negative correlations found for SERPINE1 from the overview network (A). (C) Proteins with positive or negative correlations with SERPINE1 were selected for GO term and KEGG pathway enrichment analysis (analyzed separately). The top four non-redundant terms based on Fisher’s Exact Score for both positively and negatively correlated proteins are represented with the selected term and fold enrichment. (D) TCGA protein expression for SERPINE1 in patients with various alcohol exposure. (E) SERPINE1 protein expression determined by quantitative proteomics. n.s, not significant. (F) Kaplan–Meier survival probability for patients with high (red) or low (blue) SERPINE1 expression.
Figure 7
Figure 7
PDAC subtype signatures and chemotherapy sensitivity are associated with ethanol conditioning in mutant KRAS HPNE cells. (AD) Proteomics expression data were mapped to PDAC subtype proteomics signatures. The top 60 variable proteins were selected and mapped to the PLS-DA model from Law et al. ROC curves were used to determine the cutoff scores for the Proliferative (A), Inflammatory (B), Metabolic (C), and Progenitor-like (D) subtypes. (EG) Cells were treated with chemotherapeutic drugs commonly used in PDAC therapy. HPNE, HPNE EtOH, and HPNE-KRAS cells were plated at a density of 5000 cells per well, HPNE-KRAS EtOH were plated at a density of 1000 cells per well. Cells were treated with increasing doses of Gemcitabine (E), Irinotecan (F), or Oxaliplatin (G) for 3 days. Cell viability was assessed by CellTiter-Glo following drug exposure to assess cell viability. Relative luminescence was read on a plate reader and IC50 values were determined by GraphPad Prism. Mean ± SEM; n = 4.

References

    1. Rahib L., Smith B.D., Aizenberg R., Rosenzweig A.B., Fleshman J.M., Matrisian L.M. Projecting cancer incidence and deaths to 2030: The unexpected burden of thyroid, liver, and pancreas cancers in the United States. Cancer Res. 2014;74:2913–2921. doi: 10.1158/0008-5472.CAN-14-0155. - DOI - PubMed
    1. Bailey P., Chang D.K., Nones K., Johns A.L., Patch A.M., Gingras M.C., Miller D.K., Christ A.N., Bruxner T.J., Quinn M.C., et al. Genomic analyses identify molecular subtypes of pancreatic cancer. Nature. 2016;531:47–52. doi: 10.1038/nature16965. - DOI - PubMed
    1. Collisson E.A., Sadanandam A., Olson P., Gibb W.J., Truitt M., Gu S., Cooc J., Weinkle J., Kim G.E., Jakkula L., et al. Subtypes of pancreatic ductal adenocarcinoma and their differing responses to therapy. Nat. Med. 2011;17:500–503. doi: 10.1038/nm.2344. - DOI - PMC - PubMed
    1. Moffitt R.A., Marayati R., Flate E.L., Volmar K.E., Loeza S.G., Hoadley K.A., Rashid N.U., Williams L.A., Eaton S.C., Chung A.H., et al. Virtual microdissection identifies distinct tumor- and stroma-specific subtypes of pancreatic ductal adenocarcinoma. Nat. Genet. 2015;47:1168–1178. doi: 10.1038/ng.3398. - DOI - PMC - PubMed
    1. Cao L., Huang C., Cui Zhou D., Hu Y., Lih T.M., Savage S.R., Krug K., Clark D.J., Schnaubelt M., Chen L., et al. Proteogenomic characterization of pancreatic ductal adenocarcinoma. Cell. 2021;184:5031–5052.e26. doi: 10.1016/j.cell.2021.08.023. - DOI - PMC - PubMed