. 2022 Apr 14;14(8):1994.
doi: 10.3390/cancers14081994.

MBP-11901 Inhibits Tumor Growth of Hepatocellular Carcinoma through Multitargeted Inhibition of Receptor Tyrosine Kinases

Affiliations

MBP-11901 Inhibits Tumor Growth of Hepatocellular Carcinoma through Multitargeted Inhibition of Receptor Tyrosine Kinases

Hyun Jin Park et al. Cancers (Basel). .

Abstract

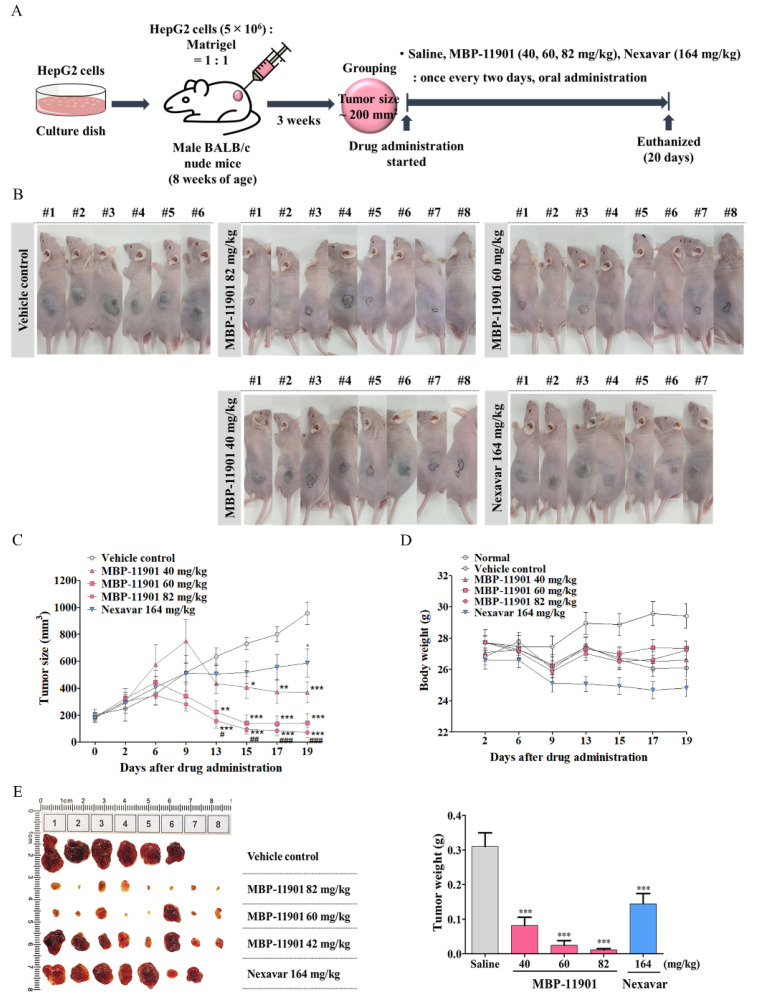
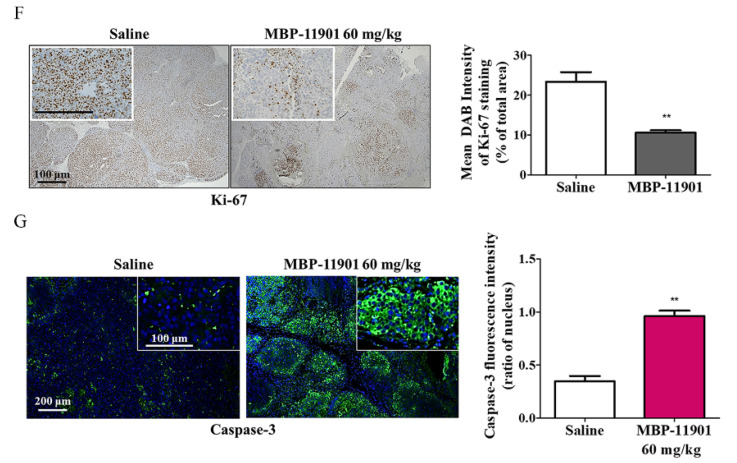
Hepatocellular carcinomas (HCCs) are aggressive tumors with a poor prognosis. Approved first-line treatments include sorafenib, lenvatinib, and a combination of atezolizumab and bevacizumab; however, they do not cure HCC. We investigated MBP-11901 as a drug candidate for HCC. Cell proliferation and cytotoxicity were evaluated using normal and cancer human liver cell lines, while Western blotting and flow cytometry evaluated apoptosis. The anticancer effect of MBP-11901 was verified in vitro through migration, invasion, colony formation, and JC-1 MMP assays. In mouse models, the tumor volume, tumor weight, and bodyweight were measured, and cancer cell proliferation and apoptosis were analyzed. The toxicity of MBP-11901 was investigated through GOT/GPT and histological analyses in the liver and kidney. The signaling mechanism of MBP-11901 was investigated through kinase assays, phosphorylation analysis, and in silico docking simulations. Results. MBP-11901 was effective against various human HCC cell lines, leading to the disappearance of most tumors when administered orally in animal models. This effect was dose-dependent, with no differences in efficacy according to administration intervals. MBP-11901 induced anticancer effects by targeting the signaling mechanisms of FLT3, VEGFR2, c-KIT, and PDGFRβ. MBP-11901 is suggested as a novel therapeutic agent for the treatment of advanced or unresectable liver cancer.

Keywords: anticancer agent; complete response; hepatocellular carcinoma; targeted therapy; tyrosine kinase inhibitor.


Conflict of interest statement

The authors have no conflict of interest to disclose.

Figures

Figure 1
Figure 1
Toxicity profiles of MBP-11901. (A) Chemical structure of MBP-11901. (B) Log IC50 of MBP-11901 for various cancer and normal cells. Normal cells, including mouse hepatocytes (AML12), human neural stem cells (NE-4C), human embryonic kidney cells (HEK-293), human breast epithelial cells (MCF 10A), human colon epithelial cells (FHC), and a variety of human cancer cell lines, were treated with MBP-11901 (1, 5, 10, 25, 50, 75, or 100 μM) for 24 h. The log IC50 of 3 independent experiments per cell line was averaged and summarized as a mean. *** p < 0.001, significant difference from AML12. ### p < 0.001 significant difference from FHC.
Figure 2
Figure 2
MBP-11901 induces apoptosis and inhibits cell migration and invasion of HepG2 cells. (A) HepG2 cells were exposed to different concentrations of MBP-11901 for 24 h and 50 μM MBP-11901 for various times (0.5, 1, 4, 8, 16, and 24 h) (B). Cell lysates were subjected to Western blot analysis to determine the expression of cleaved-PARP, caspase-3, and cleaved-caspase-3. β-actin was used as an internal control to monitor equal protein sample loading. The full-size blot is shown in Figure S3 (C). HepG2 cells were treated with MBP-11901 for 8, 16, and 24 h, and analyzed for apoptotic sub-G1 by flow cytometry (D). The inhibitory efficacy of MBP-11901 in the migration and invasion of HepG2 cells was analyzed. The bar graph for the migration assay shows the ratio of the area of migrated cells to the total area. The bar graph for the invasion assay displays the number of cells that migrated through the Matrigel and Transwell membrane. All results were independently performed 3 times, and the average value is shown. ** p < 0.01, *** p < 0.001 relative to the control.
Figure 3
Figure 3
Compared with sorafenib, MBP-11901 has a positive effect on liver cancer cell lines, whereas exhibits toxicity on normal cell lines. (A) HepG2, Hep3B, Huh7, PLC/PRF.5, and (B) normal liver AML12 cells were treated with different concentrations (1, 5, 10, 25, 50, 75, or 100 μM) of MBP-11901 or sorafenib for 24 h. Cell viability was determined by the CCK-8 assay. (C) Cytotoxicity was analyzed by LDH leakage of HepG2 and AML12 cells. (D,E) The expression of cleaved-PARP, caspase-3, and cleaved-caspase-3 was determined in MBP-11901 or sorafenib-treated cell lysates by Western blot analysis. β-actin was used as a loading control. The full-size blot is shown in Figure S4. (F) Colony formation assay in HepG2 cells. The area of the colony was analyzed using the ImageJ software and plotted using GraphPad Prism. (G) Mitochondrial depolarization of HepG2 cells treated with MBP-11901 followed by staining with JC-1 dye was observed under a fluorescence microscope. Quantitative results of the fluorescence ratio of red to green signals. All results were independently performed 3 times, and the average value is shown. *** p < 0.001 relative to the control.
Figure 4
Figure 4
Oral administration of MBP-11901 shows an excellent anticancer effect on HCC cell-derived subcutaneous xenograft tumors in nude mice. (A) Experimental design: l. Mice were s.c. implanted with HepG2 cells for about 3 weeks until tumor volume reached approximately 200 mm3. Tumor-bearing mice were divided into 5 groups—vehicle control (saline), MBP-11901 40, 60, 82 mg/kg; and Nexavar 164 mg/kg—and administered each drug orally once every 2 d. (B) Images of all mice used in the experiment after a total of 9 administrations. The black line indicates the border where the xenograft tumor mass has almost disappeared. #Numbers represent individual objects. (C) Tumor volume and body weight were measured twice a week on fixed days. After 19 d, all mice were sacrificed and tumors were removed and weighed (D,E). The harvested tumor mass was paraffin-embedded and subjected to immunohistochemical staining. (F) Proliferation was assessed using a Ki-67 antibody, while (G) apoptosis was assessed using an antibody against cleaved caspase-3. Data shown are the mean value from mice in each group. The bar graph represents the Ki-67 or cleaved caspase-3 positive intensity for each tissue. * p < 0.05, ** p < 0.01, *** p < 0.001 relative to the saline group. # p<0.05, ## p < 0.01, ### p < 0.001 relative to the Nexavar® group.
Figure 4
Figure 4
Oral administration of MBP-11901 shows an excellent anticancer effect on HCC cell-derived subcutaneous xenograft tumors in nude mice. (A) Experimental design: l. Mice were s.c. implanted with HepG2 cells for about 3 weeks until tumor volume reached approximately 200 mm3. Tumor-bearing mice were divided into 5 groups—vehicle control (saline), MBP-11901 40, 60, 82 mg/kg; and Nexavar 164 mg/kg—and administered each drug orally once every 2 d. (B) Images of all mice used in the experiment after a total of 9 administrations. The black line indicates the border where the xenograft tumor mass has almost disappeared. #Numbers represent individual objects. (C) Tumor volume and body weight were measured twice a week on fixed days. After 19 d, all mice were sacrificed and tumors were removed and weighed (D,E). The harvested tumor mass was paraffin-embedded and subjected to immunohistochemical staining. (F) Proliferation was assessed using a Ki-67 antibody, while (G) apoptosis was assessed using an antibody against cleaved caspase-3. Data shown are the mean value from mice in each group. The bar graph represents the Ki-67 or cleaved caspase-3 positive intensity for each tissue. * p < 0.05, ** p < 0.01, *** p < 0.001 relative to the saline group. # p<0.05, ## p < 0.01, ### p < 0.001 relative to the Nexavar® group.
Figure 5
Figure 5
MBP-11901 shows an excellent anticancer effect even when the interval of oral administration is changed. (A) After 42 d, at the end of the experiment, images of subcutaneously implanted model mice were taken. # Numbers represent individual objects. (B,C) Tumor volume and body weight were measured twice a week on fixed days. (D) The tumors of sacrificed mice were removed, their weights were measured, and images were taken. The bar graph shows the average weight of mice in each group. Tumors completely disappeared in all subjects administered MBP-11901. (E) Plasma levels of the liver-specific enzymes GOT and GPT. (F,G) Representative images of H&E and Masson’s trichrome staining of livers and kidneys dissected from treated mice. Star indicates a dead animal (A) and the time it died (C). ** p < 0.01, *** p < 0.001 relative to the saline-treated control group. # p < 0.05, ## p < 0.01 relative to the normal group. 1T/1D—once a day; 1T/2D—once every 2 d; 1T/3D—once every 3 d; 1T/4D—once every 4 d.
Figure 5
Figure 5
MBP-11901 shows an excellent anticancer effect even when the interval of oral administration is changed. (A) After 42 d, at the end of the experiment, images of subcutaneously implanted model mice were taken. # Numbers represent individual objects. (B,C) Tumor volume and body weight were measured twice a week on fixed days. (D) The tumors of sacrificed mice were removed, their weights were measured, and images were taken. The bar graph shows the average weight of mice in each group. Tumors completely disappeared in all subjects administered MBP-11901. (E) Plasma levels of the liver-specific enzymes GOT and GPT. (F,G) Representative images of H&E and Masson’s trichrome staining of livers and kidneys dissected from treated mice. Star indicates a dead animal (A) and the time it died (C). ** p < 0.01, *** p < 0.001 relative to the saline-treated control group. # p < 0.05, ## p < 0.01 relative to the normal group. 1T/1D—once a day; 1T/2D—once every 2 d; 1T/3D—once every 3 d; 1T/4D—once every 4 d.
Figure 6
Figure 6
MBP-11901 induces antitumor activity in the orthotopic HCC mice model. (A) Bioluminescence at different times. (B) Quantitative analysis of IVIS signal intensity (photons/sec/cm2/steradian) over time after injection (n = 10). (C) Body weight. Plasma levels of the (D) GOT and (E) GPT liver-specific enzymes (n = 10). ***, p < 0.001 relative to the saline-treated control group, #, p < 0.05 relative to the Nexavar® group. The image data for all subjects are in Figure S8.
Figure 7
Figure 7
MBP-11901 induces anticancer effects on HepG2 in vitro and in vivo by inhibiting multitarget tyrosine kinases, FLT3, VEGFR2, PDGFRβ, and c-KIT. (A) Primary KINOMEscan profiling of 10 μM MBP-11901 using a competition binding assay for 468 human protein kinases. Kinase activities of target spectrum within Selectivity Scores (S (35%)). Results of kinase activities were reported as percent control (%Ctrl), where lower numbers indicated stronger hits. Dendrogram of human kinases showing a subset of data. (B) Binding interaction of MBP-11901 against selectively targeted kinases. Results of binding interaction were assessed using binding constants (Kd), where lower numbers indicated tighter binding interaction and higher affinity. Data represent the mean ± S.D. (n = 2). The levels of expression of FLT3, VEGFR2, PDGFRβ, c-KIT, RAS, p-c-Raf, pMEK1/2, pERK1/2, pAKT, and p-mTOR were determined by Western blotting. (C) Time-dependent protein expression of MBP-11901 in HepG2 cells. (D) Changes in proteins in HepG2 cells following timely exposure to MBP-11901. (E) Changes in tumor proteins after oral administration of MBP-11901 to HepG2 subcutaneously implanted xenograft mice. The full-size blot is shown in Figure S11. (F) 2D and 3D ligand interactions of MBP-11901 with target proteins. Hydrogen bonds—cyan dotted line; salt bridges—pink dotted line; Pi interactions—green dotted line. (G) A comprehensive summary of the signaling mechanisms related to the targets of MBP-11901.
Figure 7
Figure 7
MBP-11901 induces anticancer effects on HepG2 in vitro and in vivo by inhibiting multitarget tyrosine kinases, FLT3, VEGFR2, PDGFRβ, and c-KIT. (A) Primary KINOMEscan profiling of 10 μM MBP-11901 using a competition binding assay for 468 human protein kinases. Kinase activities of target spectrum within Selectivity Scores (S (35%)). Results of kinase activities were reported as percent control (%Ctrl), where lower numbers indicated stronger hits. Dendrogram of human kinases showing a subset of data. (B) Binding interaction of MBP-11901 against selectively targeted kinases. Results of binding interaction were assessed using binding constants (Kd), where lower numbers indicated tighter binding interaction and higher affinity. Data represent the mean ± S.D. (n = 2). The levels of expression of FLT3, VEGFR2, PDGFRβ, c-KIT, RAS, p-c-Raf, pMEK1/2, pERK1/2, pAKT, and p-mTOR were determined by Western blotting. (C) Time-dependent protein expression of MBP-11901 in HepG2 cells. (D) Changes in proteins in HepG2 cells following timely exposure to MBP-11901. (E) Changes in tumor proteins after oral administration of MBP-11901 to HepG2 subcutaneously implanted xenograft mice. The full-size blot is shown in Figure S11. (F) 2D and 3D ligand interactions of MBP-11901 with target proteins. Hydrogen bonds—cyan dotted line; salt bridges—pink dotted line; Pi interactions—green dotted line. (G) A comprehensive summary of the signaling mechanisms related to the targets of MBP-11901.

Similar articles

Cited by

References

    1. Dai Q., Zhang C., Yuan Z., Sun Q., Jiang Y. Current discovery strategies for hepatocellular carcinoma therapeutics. Expert Opin. Drug Discov. 2020;15:243–258. doi: 10.1080/17460441.2020.1696769. - DOI - PubMed
    1. Beaver J.A., Howie L.J., Pelosof L., Kim T., Liu J., Goldberg K.B., Sridhara R., Blumenthal G.M., Farrell A.T., Keegan P. A 25-year experience of US Food and Drug Administration accelerated approval of malignant hematology and oncology drugs and biologics: A review. JAMA Oncol. 2018;4:849–856. doi: 10.1001/jamaoncol.2017.5618. - DOI - PubMed
    1. Kim J.Y., Chung S.M., Choi B.O., Kay C.S. Hepatocellular carcinoma with portal vein tumor thrombosis: Improved treatment outcomes with external beam radiation therapy. Hepatol. Res. 2011;41:813–824. doi: 10.1111/j.1872-034X.2011.00826.x. - DOI - PubMed
    1. Baek Y.H., Kim K.T., Lee S.W., Jeong J.S., Park B.H., Nam K.J., Cho J.H., Kim Y.H., Roh Y.H., Lee H.S. Efficacy of hepatic arterial infusion chemotherapy in advanced hepatocellular carcinoma. World J. Gastroenterol. 2012;18:3426. doi: 10.3748/wjg.v18.i26.3426. - DOI - PMC - PubMed
    1. Llovet J.M., Ricci S., Mazzaferro V., Hilgard P., Gane E., Blanc J.-F., De Oliveira A.C., Santoro A., Raoul J.-L., Forner A. Sorafenib in advanced hepatocellular carcinoma. N. Engl. J. Med. 2008;359:378–390. doi: 10.1056/NEJMoa0708857. - DOI - PubMed

LinkOut - more resources