. 2022 Apr 18;14(8):2034.
doi: 10.3390/cancers14082034.

A Bioinformatics Evaluation of the Role of Dual-Specificity Tyrosine-Regulated Kinases in Colorectal Cancer

Affiliations

A Bioinformatics Evaluation of the Role of Dual-Specificity Tyrosine-Regulated Kinases in Colorectal Cancer

Amina Jamal Laham et al. Cancers (Basel). .

Abstract

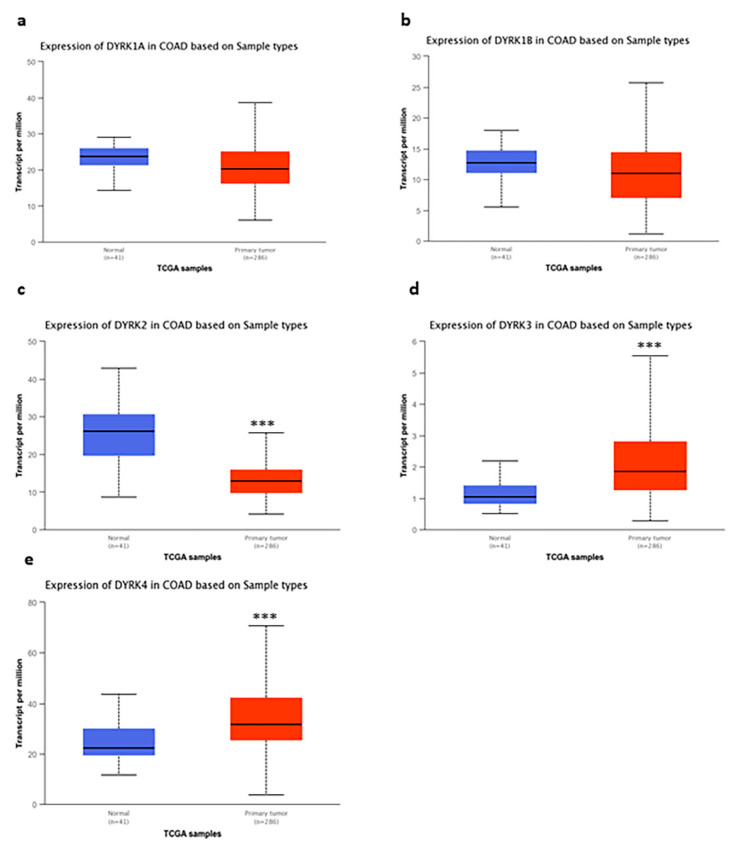
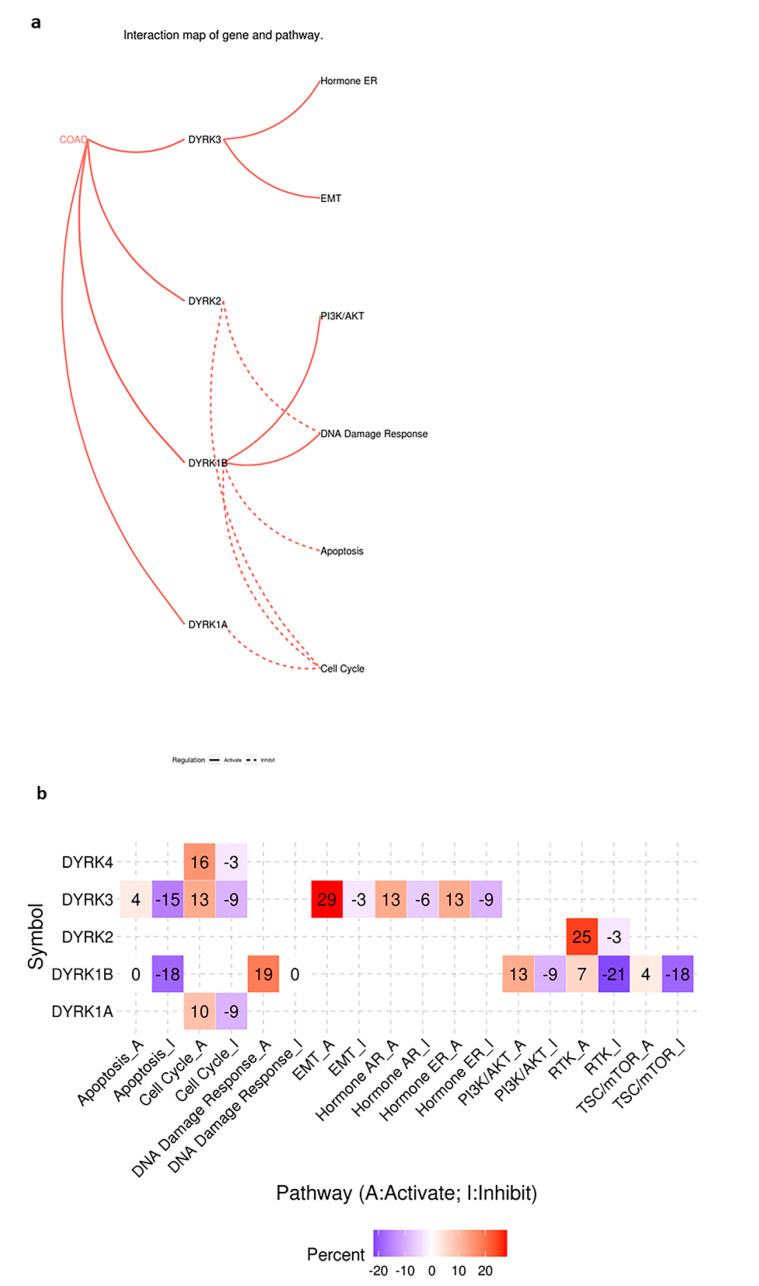
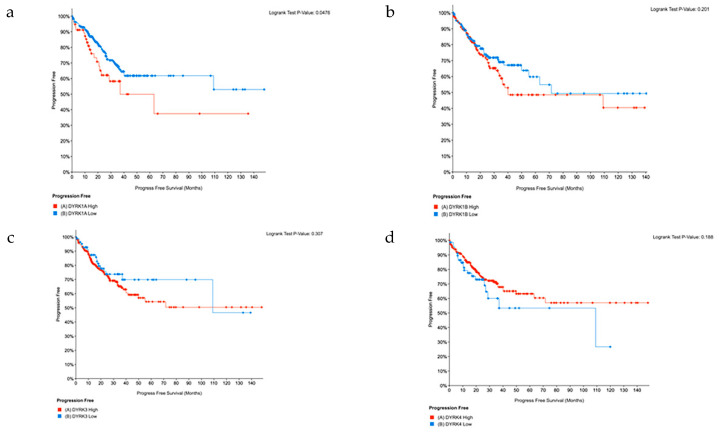
Colorectal cancer (CRC) is the third most common cancer worldwide and has an increasing incidence in younger populations. The dual-specificity tyrosine-regulated kinase (DYRK) family has been implicated in various diseases, including cancer. However, the role and contribution of the distinct family members in regulating CRC tumorigenesis has not been addressed yet. Herein, we used publicly available CRC patient datasets (TCGA RNA sequence) and several bioinformatics webtools to perform in silico analysis (GTEx, GENT2, GEPIA2, cBioPortal, GSCALite, TIMER2, and UALCAN). We aimed to investigate the DYRK family member expression pattern, prognostic value, and oncological roles in CRC. This study shed light on the role of distinct DYRK family members in CRC and their potential outcome predictive value. Based on mRNA level, DYRK1A is upregulated in late tumor stages, with lymph node and distant metastasis. All DYRKs were found to be implicated in cancer-associated pathways, indicating their key role in CRC pathogenesis. No significant DYRK mutations were identified, suggesting that DYRK expression variation in normal vs. tumor samples is likely linked to epigenetic regulation. The expression of DYRK1A and DYRK3 expression correlated with immune-infiltrating cells in the tumor microenvironment and was upregulated in MSI subtypes, pointing to their potential role as biomarkers for immunotherapy. This comprehensive bioinformatics analysis will set directions for future biological studies to further exploit the molecular basis of these findings and explore the potential of DYRK1A modulation as a novel targeted therapy for CRC.

Keywords: DYRK1A; bioinformatics; colorectal cancer; dual-specificity tyrosine-regulated kinases (DYRKs); kinases; targeted therapy.


Conflict of interest statement

The authors declare no conflict of interest.

Figures

Figure 1
Figure 1
DYRKs expression in normal colon tissue: Using the GTEx portal web tool, DYRKs expression level from colon tissue was calculated based on RNAseq. TPM = transcript per million.
Figure 2
Figure 2
DYRKs expression in colon adenocarcinoma vs. normal tissues: using RNA seq dataset from TCGA data in UALCAN web tool we compared the expression of DYRKs in normal samples vs. tumor samples in colon adenocarcinoma. Student’s t-test was performed (a) DYRK1A, (b) DYRK1B, (c) DYRK2, (d) DYRK3 and (e) DYRK4. *** p < 0.001.
Figure 3
Figure 3
DYRKs expression in rectal adenocarcinoma vs. normal tissues: using RNA seq dataset from TCGA data in UALCAN web tool, we compared the expression of DYRKs in normal samples vs. tumor samples in colon adenocarcinoma. Student’s t-test was performed (a) DYRK1A, (b) DYRK1B, (c) DYRK2, (d) DYRK3 and (e) DYRK4. ** p < 0.01 and *** p < 0.001.
Figure 4
Figure 4
DYRKs expression level in colon cancer molecular subtypes. Using GENT2 web-based tool to represent data from NCBI GEO database, we query each DYRKs alone and chose colon cancer as tissue type and subtype as the targeted analysis. (a) DYRK1A, (b) DYRK1B, (c) DYRK2, (d) DYRK3 and (e) DYRK4. Two sample T tests were conducted by the GENT2 web tool, p < 0.005 was considered as significant.
Figure 5
Figure 5
DYRKs expression level in CRC stages: using GEPIA2 web server that provide RNA seq from TCGA data set, DYRKs level in CRC stages were investigated. (a) DYRK1A, (b) DYRK1B, (c) DYRK2, (d) DYRK3 and (e) DYRK4.
Figure 6
Figure 6
DYRKs status in CRC histological subtypes. PAN TCGA adenocarcinoma data set were used from cBioPortal. Samples were filtered based on mRNA z-score relative to normal samples (Log RNAseq V2 RSEM). Samples with mRNA z score = or >1 were considered high, and samples with mRNA z score <1 were considered low. (a) DYRK1A, (b) DYRK1B, (c) DYRK3 and (d) DYRK4.
Figure 7
Figure 7
DYRKs status in metatsais and lymph node stages in CRC. PAN TCGA adenocarcinoma data set was used from cBioPortal. Samples were filtered based on mRNA z-score relative to normal samples (Log RNAseq V2 RSEM). Samples with mRNA z score = or >1 were considered high, and samples with mRNA z score <1 were considered low. (a) Lymph node stage for DYRK1A, (b) lymph node stage for DYRK1A, (c) metastasis stage for DYRK1B, (d) lymph node stage for DYRK1B, (e) metastasis stage for DYRK3, (f) lymph node stage for DYRK3, (g) metastasis stage for DYRK4 and (h) lymph node stage for DYRK4.
Figure 8
Figure 8
New newplasm event indicator. PAN TCGA adenocarcinoma data set were used from cBioPortal. Samples were filtered based on mRNA z-score relative to normal samples (Log RNAseq V2 RSEM). Samples with mRNA z score = or >1 were considered high, and samples with mRNA z score <1 were considered low. (a) DYRK1A, (b) DYRK1B, (c) DYRK3 and (d) DYRK4.
Figure 9
Figure 9
Mutations and copy number variation of DYRKs in CRC. Oncoprint represent DYRKs mutation and copy number in Pan TCGA adenocarcinoma data set obtained from cBioPortal. mRNA z-score relative to normal samples (Log RNAseq V2 RSEM) were chosen.
Figure 10
Figure 10
Promotor methylation level of DYRKs in COAD and READ. TCGA data set was obtained from UALCAN web tool. (a,b) DYRK1A, (c,d) DYRK1B, (e,f) DYRK2, (g,h) DYRK3 and (i,j) DYRK4. * p < 0.05.
Figure 11
Figure 11
Cancer pathway activity of DYRKs predicted from GSCALite web tool. (a) Predicted pathways in COAD. (b) Predicted pathways in global cancers.
Figure 12
Figure 12
Spearman’s rank correlation coefficient of immune filtrating cells abundance and DYRKs expression in COAD obtained from TIMER 2 web tool.
Figure 13
Figure 13
Progression-Free Survival. Pan TCGA adenocarcinoma data set were used from cBioPortal. Samples were filtered based on mRNA z-score relative to normal samples (Log RNAseq V2 RSEM). Samples with mRNA z score = or >1 were considered high and samples with mRNA z score <1 were considered low. (a) DYRK1A, (b) DYRK1, (b,c) DYRK3 and (d) DYRK4.
Figure 14
Figure 14
Overall Survival. Using GEPIA2 web server that provide RNA seq from TCGA data set, DYRKs overall survival for CRC patient were investigated. (a) DYRK1A, (b) DYRK1B, (c) DYRK2, (d) DYRK3 and (e) DYRK4.

Similar articles

Cited by

References

    1. Sung H., Ferlay J., Siegel R.L., Laversanne M., Soerjomataram I., Jemal A., Bray F. Global Cancer Statistics 2020: GLOBOCAN Estimates of Incidence and Mortality Worldwide for 36 Cancers in 185 Countries. CA Cancer J. Clin. 2021;71:209–249. doi: 10.3322/caac.21660. - DOI - PubMed
    1. Zacharakis M., Xynos I.D., Lazaris A., Smaro T., Kosmas C., Dokou A., Felekouras E., Antoniou E., Polyzos A., Sarantonis J., et al. Predictors of survival in stage IV metastatic colorectal cancer. Anticancer Res. 2010;30:653–660. - PubMed
    1. Gallagher D., Kemeny N. Metastatic Colorectal Cancer: From Improved Survival to Potential Cure. Oncology. 2010;78:237–248. doi: 10.1159/000315730. - DOI - PubMed
    1. Kow A.W.C. Hepatic metastasis from colorectal cancer. J. Gastrointest. Oncol. 2019;10:1274–1298. doi: 10.21037/jgo.2019.08.06. - DOI - PMC - PubMed
    1. Al Bandar M.H., Kim N.K. Current status and future perspectives on treatment of liver metastasis in colorectal cancer (Review) Oncol. Rep. 2017;37:2553–2564. doi: 10.3892/or.2017.5531. - DOI - PubMed

LinkOut - more resources