

Osteogenic Effect of Pregabalin in Human Primary Mesenchymal Stem Cells, Osteoblasts, and Osteosarcoma Cells
- PMID: 35454987
- PMCID: PMC9032037
- DOI: 10.3390/life12040496
Osteogenic Effect of Pregabalin in Human Primary Mesenchymal Stem Cells, Osteoblasts, and Osteosarcoma Cells
Abstract
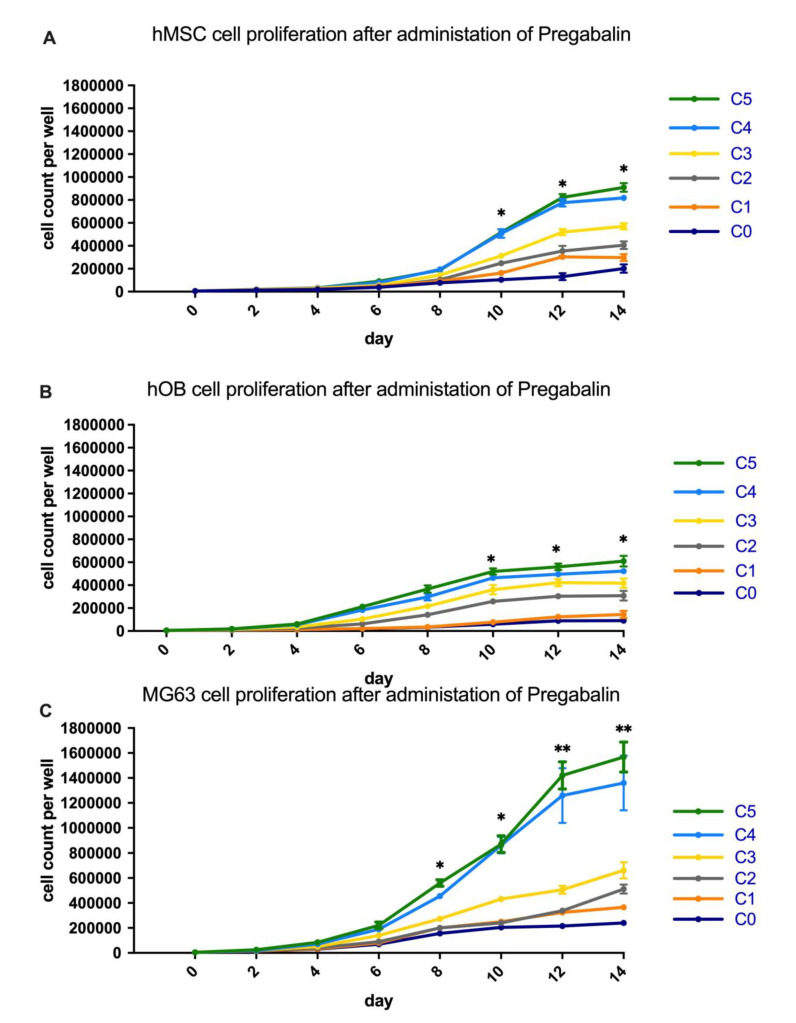
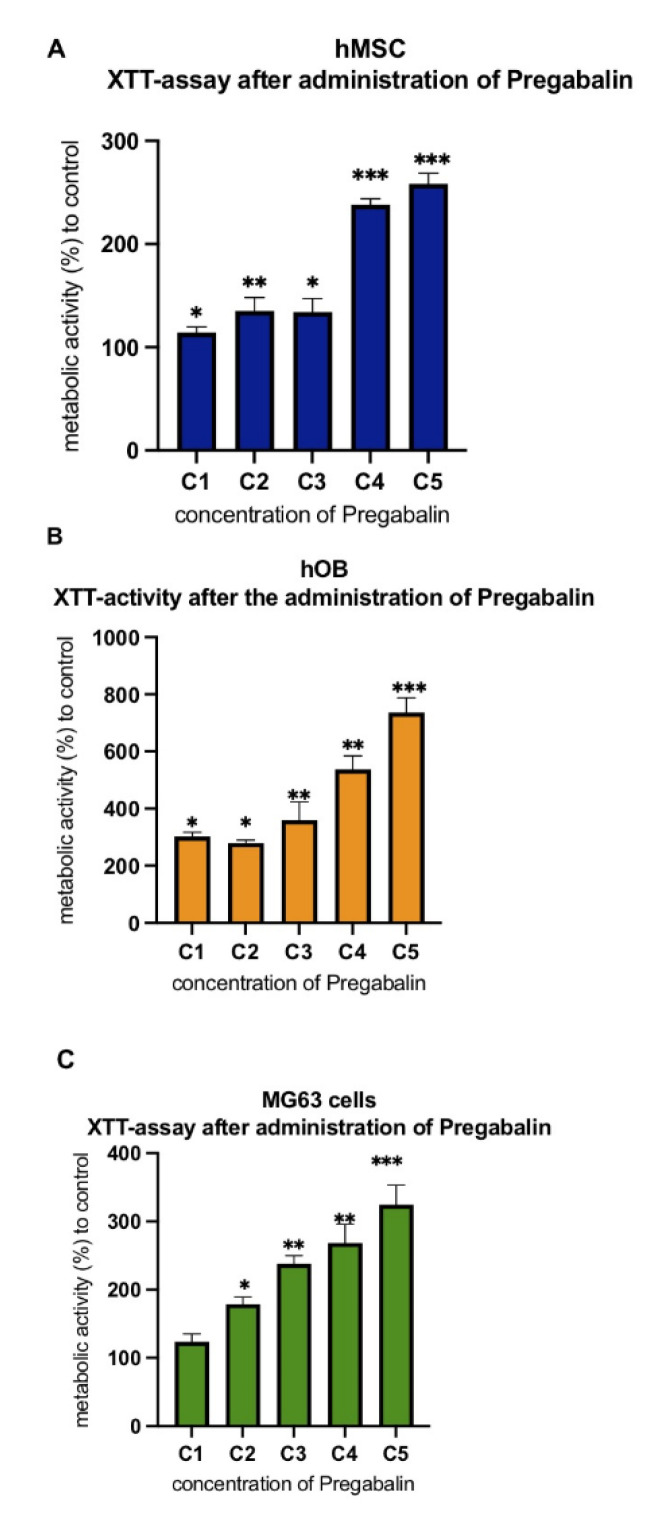
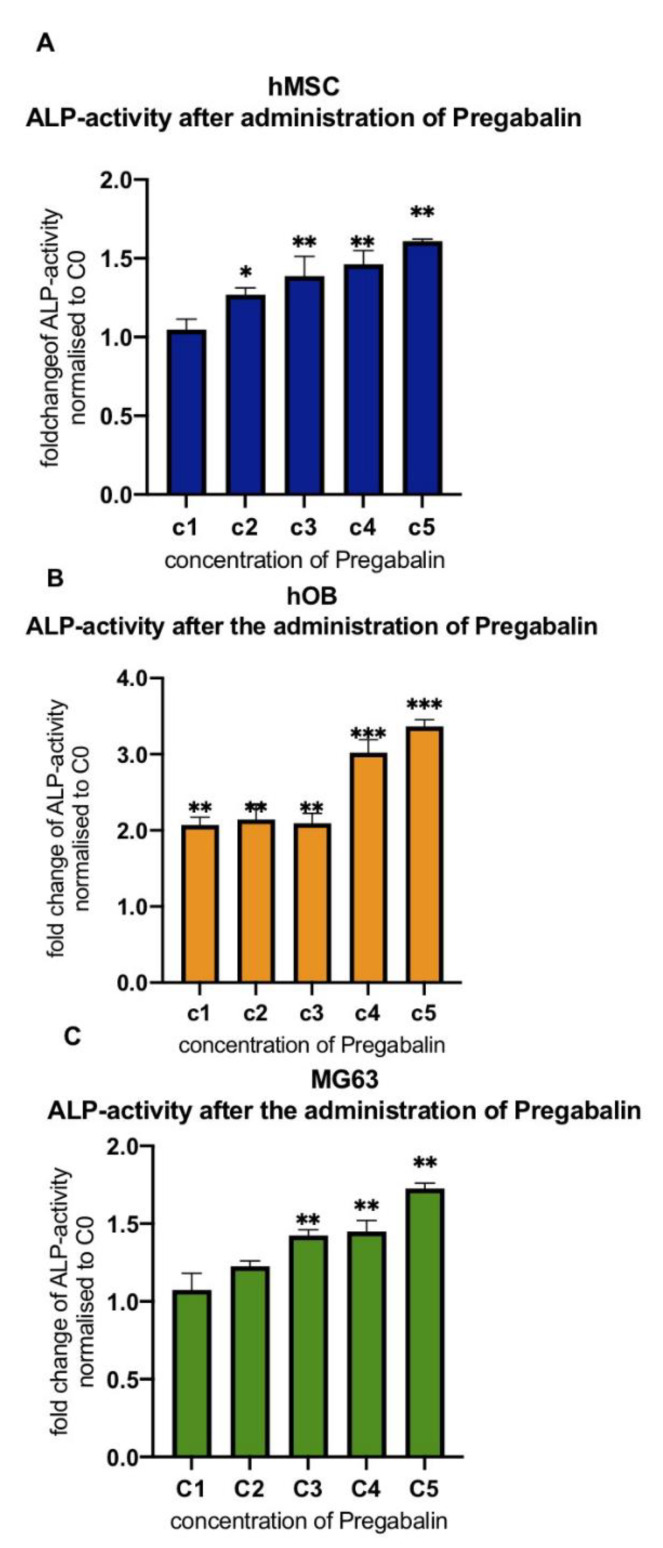
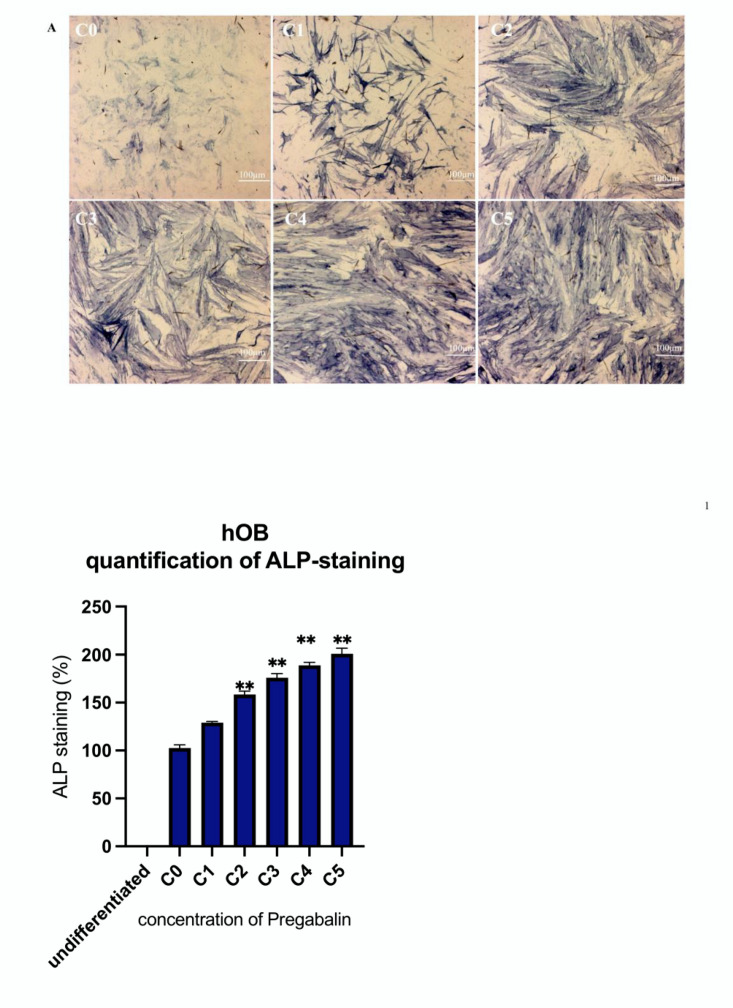
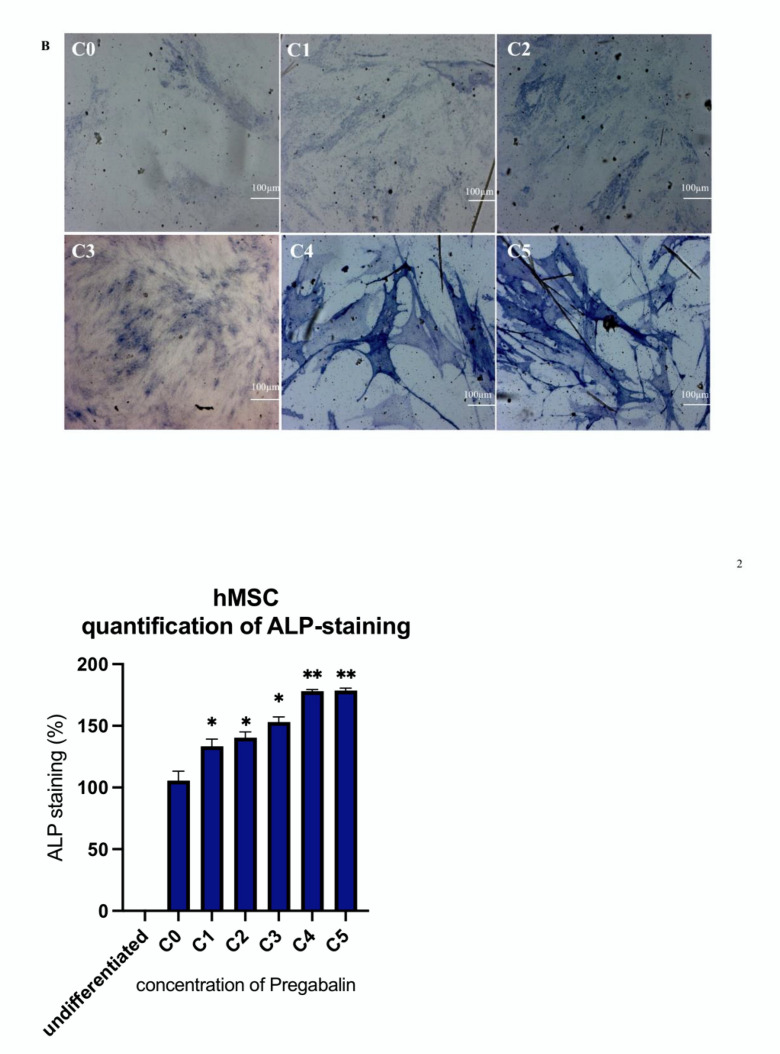
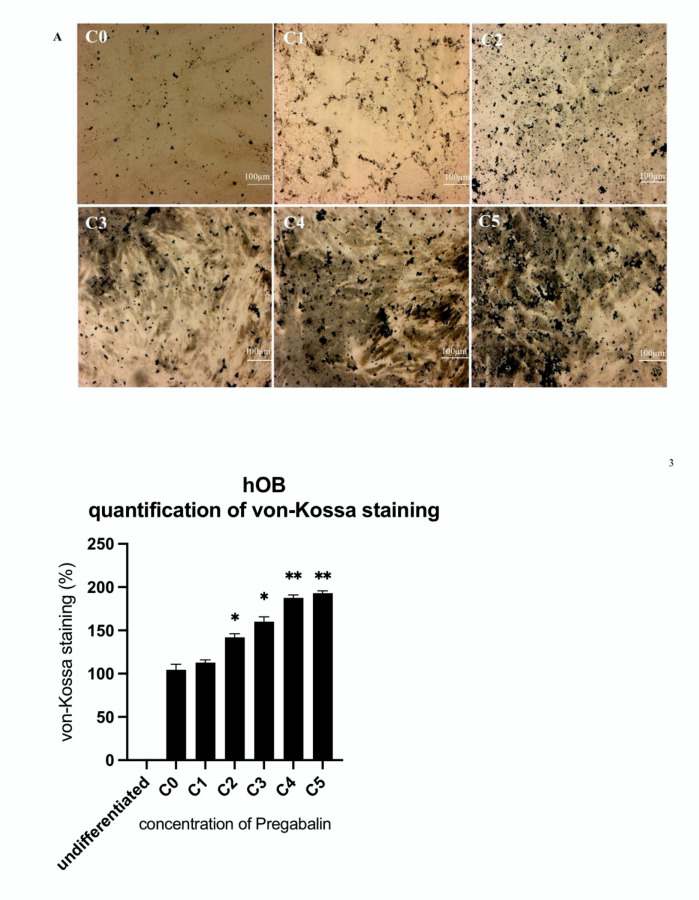
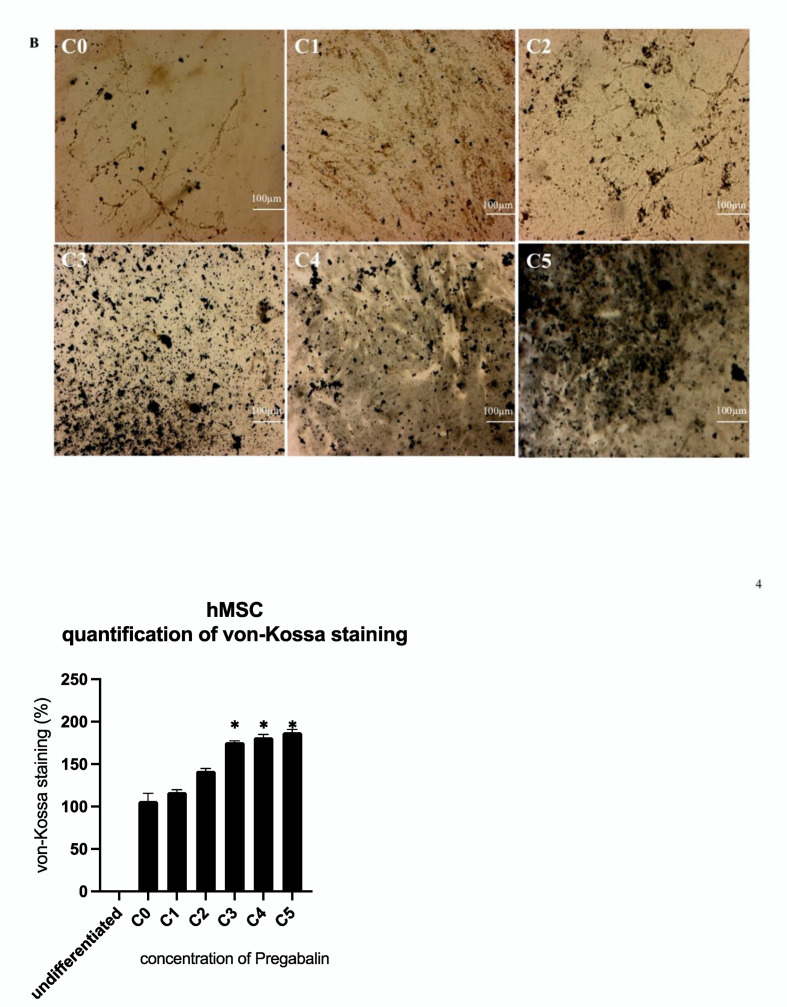
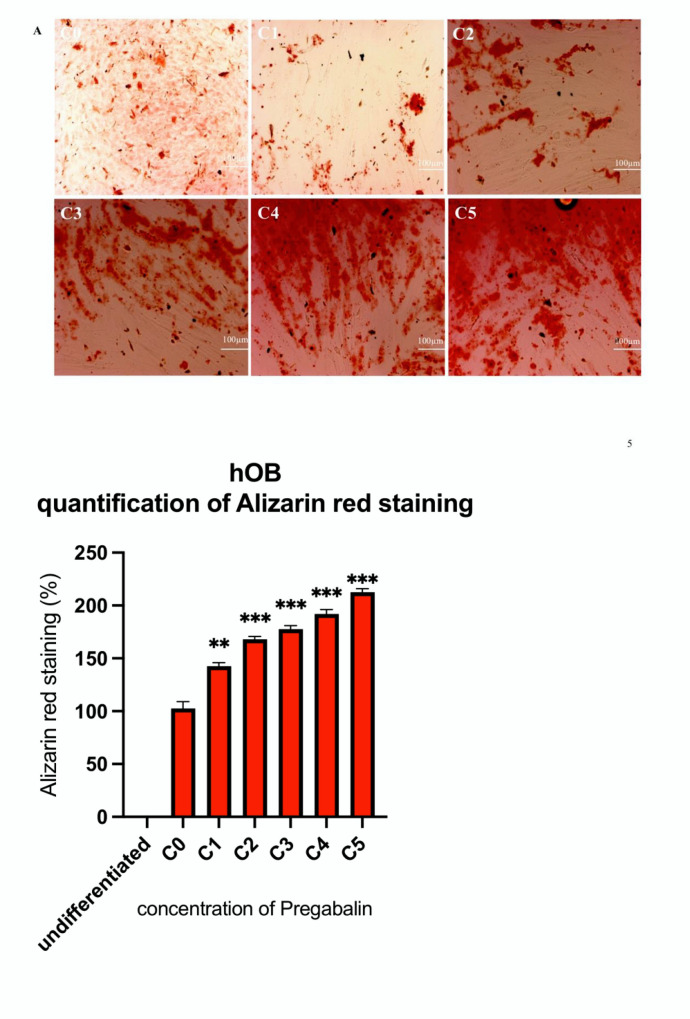
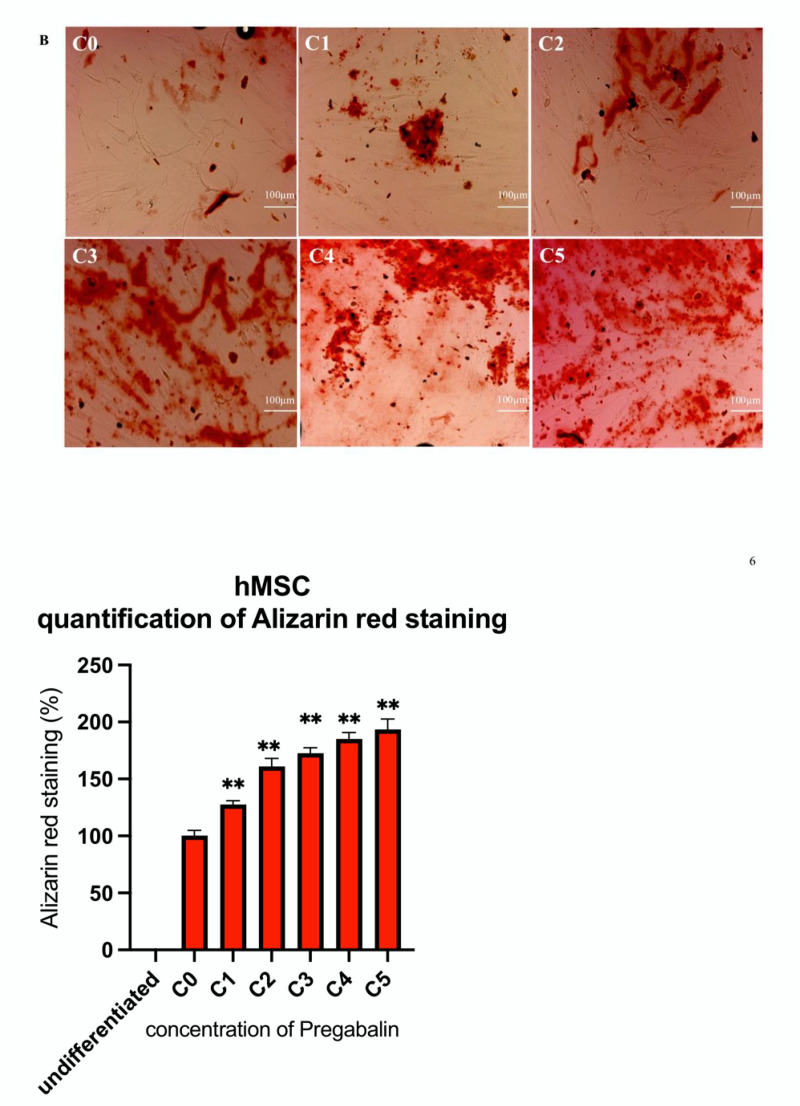
Seventy million patients worldwide are suffering from epilepsy. The long-term use of antiepileptic drugs causes the alteration of the bone tissue and its metabolism, thus increasing the risk of fractures. Clinical and pre-clinical studies have highlighted conflicting data on the influence of the relatively new antiepileptic drug pregabalin (Lyrica®). The objective of the present study was therefore to investigate its cytotoxicity in primary human osteoblasts (hOB). HOB and human mesenchymal stem cells (hMSC) were isolated from patients. The human osteosarcoma cells MG63 were included as established cell line. Cells were incubated with pregabalin at concentrations ranging from 0 to 40 μg/mL. Time-dependent cell proliferation was measured by automatic cell counting, and metabolism was determined by XTT assay and osseous differentiation by alkaline phosphatase (ALP) activity. Histological examinations of calcium deposit were performed with ALP, Alizarin Red, and von Kossa staining. A concentration-dependent increase in the proliferation of hOB and hMSC was observed after treatment with pregabalin. All cells showed a significant increase in cell metabolism. The osteogenic differentiation, confirmed by the increase of calcium deposit, was promoted by the administration of pregabalin. This effect was already significant at the therapeutic plasma concentration of pregabalin (10 μg/mL). In contrast to the other antiepileptic drugs, pregabalin showed no osteocatabolic effects. Conflicting in-vivo data must therefore be attributed to systemic effects of pregabalin.
Keywords: antiepileptic drugs; bone defects; human bone cells; osteoblastogenesis; pregabalin.
Conflict of interest statement
The authors declare no conflict of interest.
Figures
Similar articles
-
Does Riluzole Influence Bone Formation?: An In Vitro Study of Human Mesenchymal Stromal Cells and Osteoblast.Spine (Phila Pa 1976). 2019 Aug 15;44(16):1107-1117. doi: 10.1097/BRS.0000000000003022. Spine (Phila Pa 1976). 2019. PMID: 30896584
-
Osteogenic differentiation of rat mesenchymal stem cells from adipose tissue in comparison with bone marrow mesenchymal stem cells: melatonin as a differentiation factor.Iran Biomed J. 2008 Jul;12(3):133-41. Iran Biomed J. 2008. PMID: 18762816
-
[EXPERIMENTAL STUDY ON OSTEOGENESIS OF SYNOVIUM-DERIVED MESENCHYMAL STEM CELLS IN VITRO AND IN VIVO].Zhongguo Xiu Fu Chong Jian Wai Ke Za Zhi. 2016 Jan;30(1):102-9. Zhongguo Xiu Fu Chong Jian Wai Ke Za Zhi. 2016. PMID: 27062856 Chinese.
-
Petroleum ether extract of Cissus quadrangularis (Linn.) enhances bone marrow mesenchymal stem cell proliferation and facilitates osteoblastogenesis.Clinics (Sao Paulo). 2009;64(10):993-8. doi: 10.1590/S1807-59322009001000010. Clinics (Sao Paulo). 2009. PMID: 19841707 Free PMC article.
-
Human mesenchymal stem cell proliferation and osteogenic differentiation in fibrin gels in vitro.Tissue Eng. 2006 Aug;12(8):2385-96. doi: 10.1089/ten.2006.12.2385. Tissue Eng. 2006. PMID: 16968177
Cited by
-
The presence of a fat layer after neoadjuvant chemotherapy as an indicator of prognosis in osteosarcoma.Front Oncol. 2025 Apr 11;15:1514560. doi: 10.3389/fonc.2025.1514560. eCollection 2025. Front Oncol. 2025. PMID: 40291910 Free PMC article.
-
Effects of Gabapentin and Pregabalin on Calcium Homeostasis: Implications for Physical Rehabilitation of Musculoskeletal Tissues.Curr Osteoporos Rep. 2022 Dec;20(6):365-378. doi: 10.1007/s11914-022-00750-x. Epub 2022 Sep 23. Curr Osteoporos Rep. 2022. PMID: 36149592 Free PMC article. Review.
-
Targeted Clindamycin Delivery Systems: Promising Options for Preventing and Treating Bacterial Infections Using Biomaterials.Int J Mol Sci. 2024 Apr 16;25(8):4386. doi: 10.3390/ijms25084386. Int J Mol Sci. 2024. PMID: 38673971 Free PMC article. Review.
References
-
- Carbone L.D., Johnson K.C., Robbins J., Larson J.C., Curb J.D., Watson K., Gass M., Lacroix A.Z. Antiepileptic drug use, falls, fractures, and BMD in postmenopausal women: Findings from the women’s health initiative (WHI) J. Bone Miner Res. 2010;25:873–881. doi: 10.1359/jbmr.091027. - DOI - PMC - PubMed
LinkOut - more resources
Full Text Sources
