. 2022 Mar 26;24(4):458.
doi: 10.3390/e24040458.

OxDNA to Study Species Interactions

Affiliations

OxDNA to Study Species Interactions

Francesco Mambretti et al. Entropy (Basel). .

Abstract

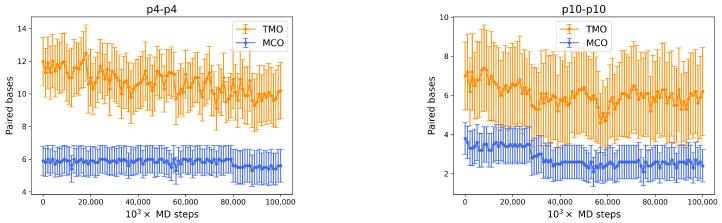
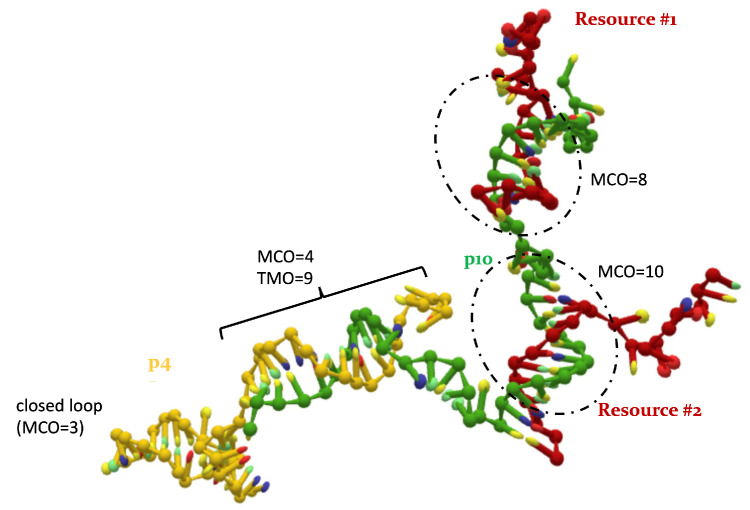
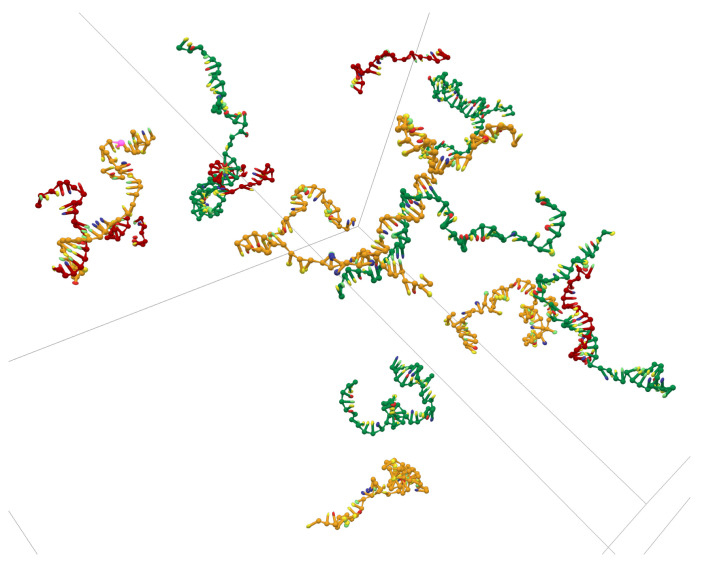
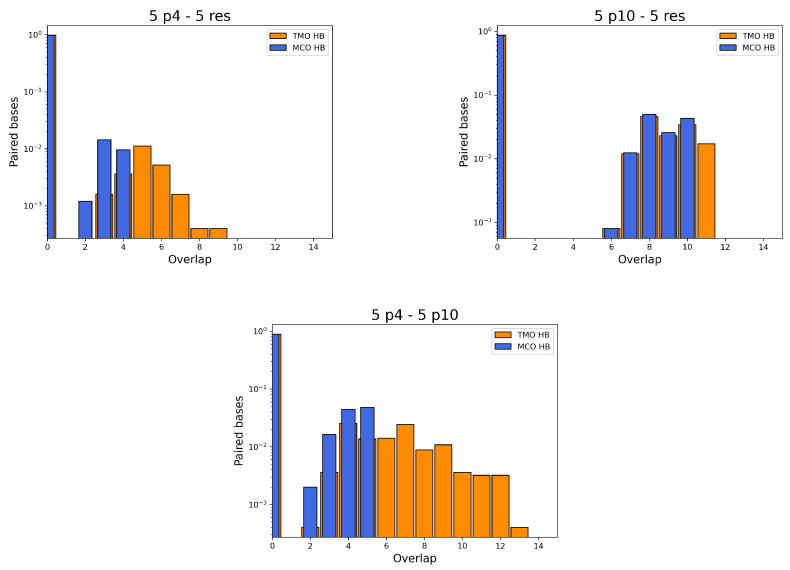
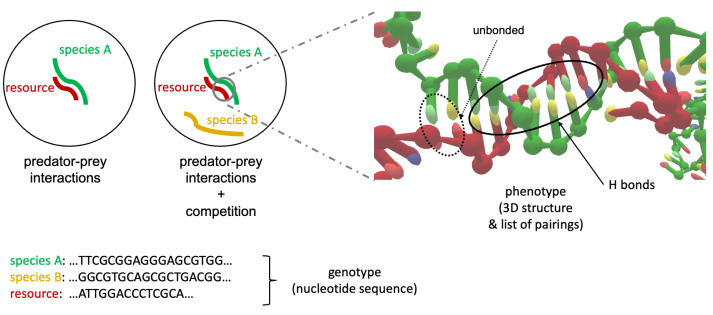
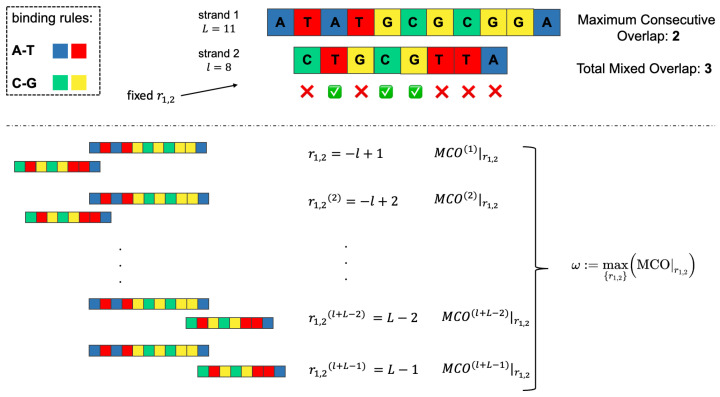
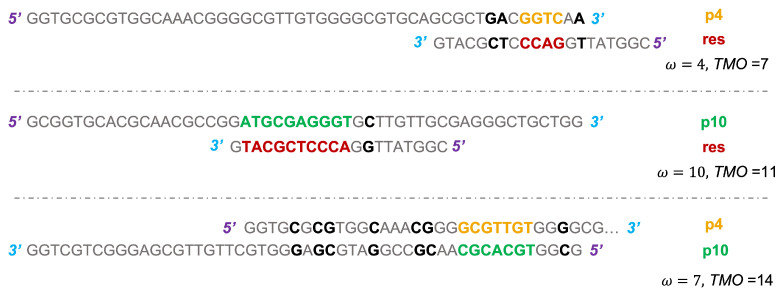
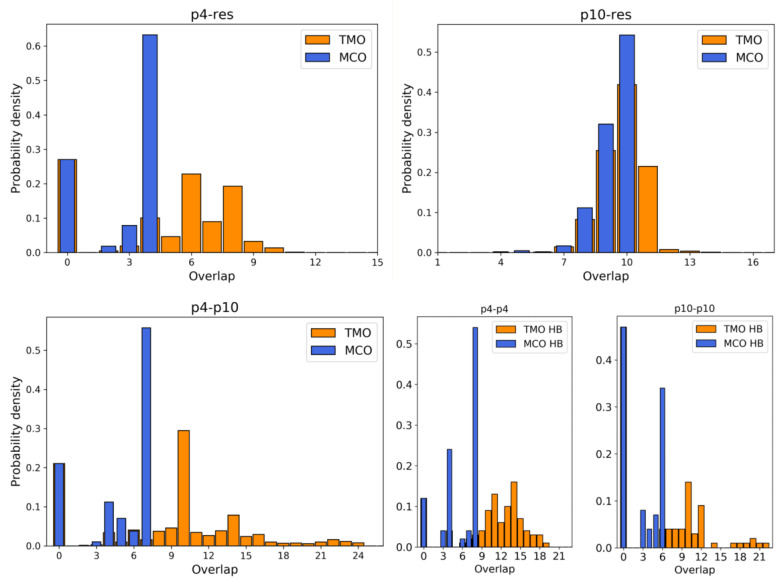
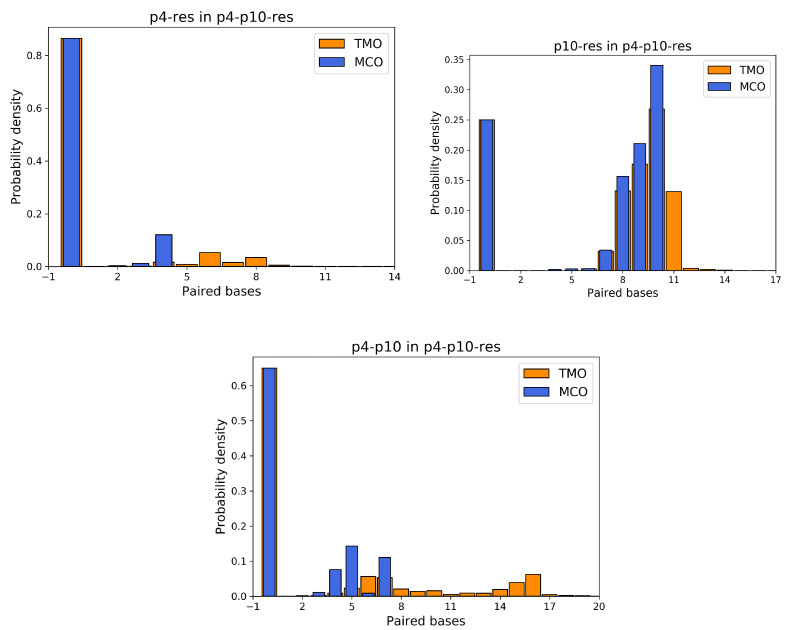
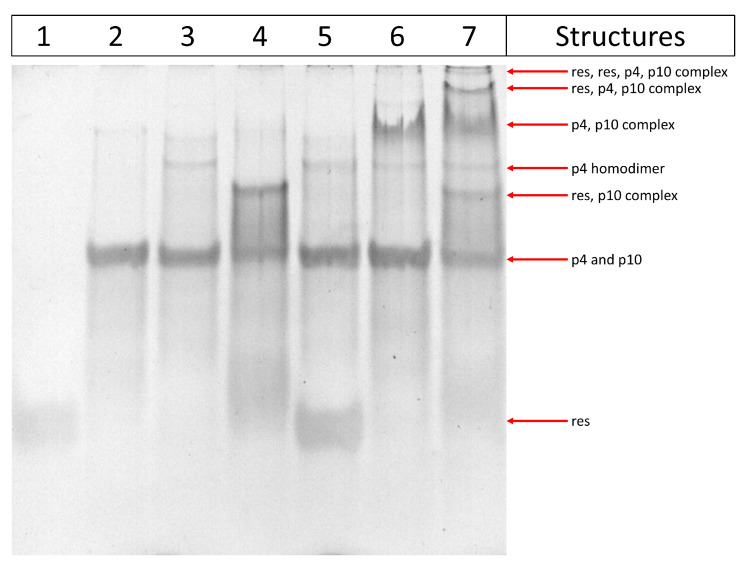
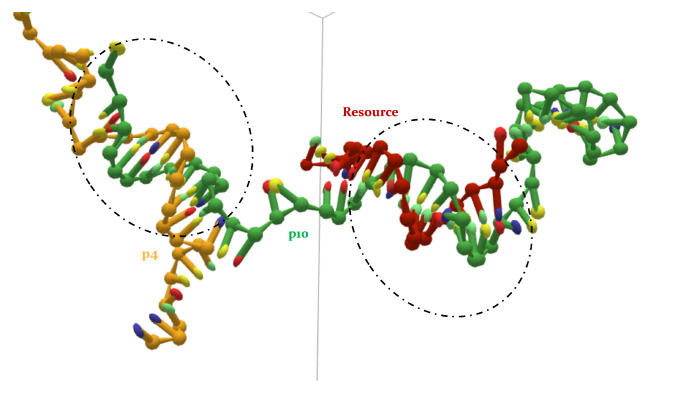
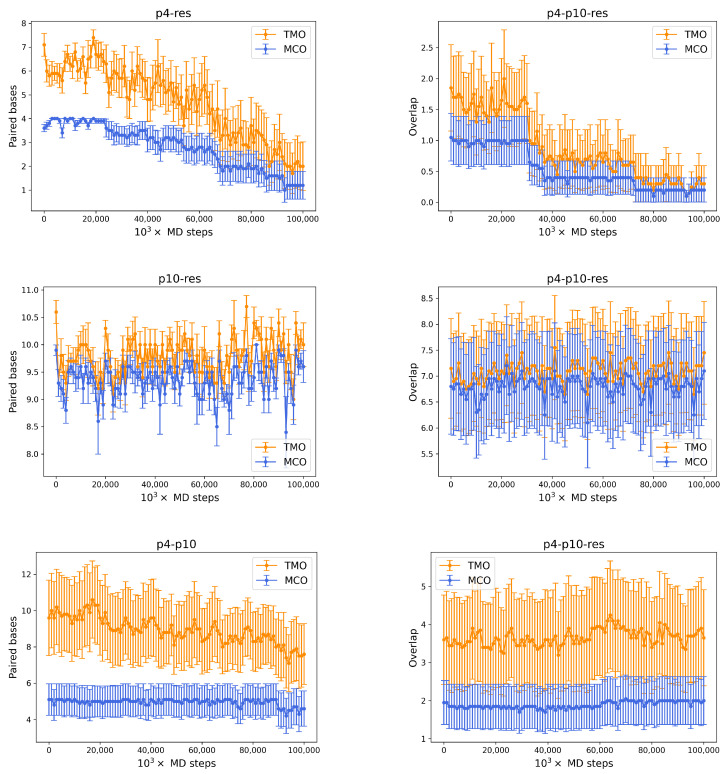
Molecular ecology uses molecular genetic data to answer traditional ecological questions in biogeography and biodiversity, among others. Several ecological principles, such as the niche hypothesis and the competitive exclusions, are based on the fact that species compete for resources. More in generally, it is now recognized that species interactions play a crucial role in determining the coexistence and abundance of species. However, experimentally controllable platforms, which allow us to study and measure competitions among species, are rare and difficult to implement. In this work, we suggest exploiting a Molecular Dynamics coarse-grained model to study interactions among single strands of DNA, representing individuals of different species, which compete for binding to other oligomers considered as resources. In particular, the well-established knowledge of DNA-DNA interactions at the nanoscale allows us to test the hypothesis that the maximum consecutive overlap between pairs of oligomers measure the species' competitive advantages. However, we suggest that a more complex structure also plays a role in the ability of the species to successfully bind to the target resource oligomer. We complement the simulations with experiments on populations of DNA strands which qualitatively confirm our hypotheses. These tools constitute a promising starting point for further developments concerning the study of controlled, DNA-based, artificial ecosystems.

Keywords: ecological competition; molecular dynamics; single-stranded DNA.


Conflict of interest statement

The authors declare no conflict of interest. The funders had no role in the design of the study; in the collection, analyses, or interpretation of data; in the writing of the manuscript, or in the decision to publish the results.

Figures

Figure A1
Figure A1
Number of bonded base pairs (TMO: orange, MCO: blue) as a function of time during MD simulations with two p4 strands (left) and two p10 strands (right). In both cases, bindings appear quite stable over the simulated time window, suggesting that predators (even in simulations with many oligomers) can take long-lived bonded conformations.
Figure A2
Figure A2
Frame from MD simulation with oxDNA, realized with oxView (https://github.com/sulcgroup/oxdna-viewer/, accessed on 24 February 2022 [30]). Example of high-order interactions: p10 (green) attaches to two resources (red), forming an MCO =ω with one of them and a weaker bond at one end of the filament with the other. p4 (gold) binds at the opposite end along the p10 strand, attempting also to form an hairpin.
Figure A3
Figure A3
Illustrative example of a frame from MD simulation with 15 oligomers, realized with oxView (https://github.com/sulcgroup/oxdna-viewer/, accessed on 24 February 2022 [30]). This configuration does not express any relevant information about the true pairing statistics. In this peculiar conformation, at least two p10 (green) strands are evidently bonded to as many resources (red). One p4 (left) forms a few HBs with a resource, while at the middle of the cell some p4 and some p10 are interacting.
Figure A4
Figure A4
Probability densities for TMO and MCO between any p4 and any resource (top left), any p10 and any resource (top right) and any p4 and any p10 (bottom), in the simulations with 15 ssDNAs left free in the simulation cell. Note the y-log scale, due to the fact that the vast majority of the timesteps are spent alone by all the oligomers (i.e., populating only bin 0), because of their initial non-overlapping positions. From these histograms, apparently, the p4 and p10 strands can bind in many ways; moreover, the p10-res binding is more probable than the p4-res one and it also features a higher number of attached bases. Even more interestingly, despite not having been biased in any way to form their ω, the actual MCO measured in these simulations is somehow often equal (or close to) ω itself.
Figure 1
Figure 1
(Left): schematization of a paradigmatic ecosystem with a single species A interacting with a resource; aside, the presence of a second individual belonging to a different species B induces a competition between A and B for the resource. (Right): graphical representation (obtained with the oxView utility: https://github.com/sulcgroup/oxdna-viewer/ accessed on 24 February 2022 [30]) of the 3D configuration originated by the interaction of a predator (species A) with a resource, when they are ssDNA filaments. Bonded and unbonded base pairs are evidenced, corresponding to the secondary structure (phenotype). The sequences of nucleotides identifying each of the three strands can be thought as the genotype of each individual.
Figure 2
Figure 2
(Top left): binding rules for canonical DNA base pairs interactions. (Top right): given a strand 1 of length L=11 and a strand 2 of length l=8, schematization of the MCO and TMO between them. In this peculiar r1,2, there is a total of three matching base pairs, but only two of them are consecutive (hence, MCO = 2 and TMO = 3). (Bottom): representation of the calculation of ω for strand 1 and strand 2. An MCO|r1,2 is determined for each relative position r1,2 between them, and then the largest is selected.
Figure 3
Figure 3
Scheme of the binding between p4 and res (top), where the bases forming the MCO =ω are in bold font and colored in gold (p4) and in firebrick (res). The other bases contributing to the TMO are in black color and bold font. The same applies for p10-res interaction (middle), where the bases of p10 involved in the formation of MCO =ω are colored in green. The (bottom) panel shows the configuration for the formation of MCO =ω between a p4 and a p10 strand, with the usual color scheme. The 5 and 3 ends are colored, respectively, in purple and cyan, highlighting the reciprocal orientation of strands.
Figure 4
Figure 4
Histograms representing the probability density (obtained by cumulating the data from n=10 MD simulations) to find a given MCO (blue)/TMO (orange) between pairs of strands at equilibrium. (Top): p4-res (left), p10-res (right); (bottom): p4-p10 (left), p4-p4 (middle) and p10-p10 (right).
Figure 5
Figure 5
Probability densities for TMO and MCO between p4 and resource (top left), p10 and resource (top right) and p4 and p10 (bottom), in the simulations with three ssDNAs.
Figure 6
Figure 6
Polyacrylamide gel showing the interactions between ssDNA oligomers. Samples are prepared by mixing p4, p10 and res ssDNA oligomers, and separated on a 20% polyacrylamide gel for 4h. Each lane contains a different combination of ssDNA oligomers. Lane 1: res only; lane 2: p10 only; lane 3: p4 only; lane 4: res, p10; lane 5: res, p4; lane 6: p4, p10; lane 7: res, p4, p10. Arrows indicate gel bands and the corresponding structures formed by ssDNA oligomers.
Figure 7
Figure 7
Frame from MD simulation with oxDNA, realized with oxView (https://github.com/sulcgroup/oxdna-viewer/ accessed on 24 February 2022 [30]). Example of high-order interactions: p10 (green) forms some HBs with the resource (red) and p4 (gold) binds elsewhere along the p10 strand.
Figure 8
Figure 8
(Left) column: number of paired bases (TMO: orange, MCO: blue) between strands pairs as a function of time during MD simulations with p4-res (top), p10-res (middle) and p4-p10 (bottom). (Right): corresponding quantities for the simulation with one p4, one p10 and one resource.

References

    1. Bascompte J., Jordano P. Plant-animal mutualistic networks: The architecture of biodiversity. Annu. Rev. Ecol. Evol. Syst. 2007;38:567–593. doi: 10.1146/annurev.ecolsys.38.091206.095818. - DOI
    1. Hagen M., Kissling W.D., Rasmussen C., De Aguiar M.A., Brown L.E., Carstensen D.W., Alves-Dos-Santos I., Dupont Y.L., Edwards F.K., Genini J., et al. Biodiversity, species interactions and ecological networks in a fragmented world. Adv. Ecol. Res. 2012;46:89–210.
    1. Suweis S., Simini F., Banavar J.R., Maritan A. Emergence of structural and dynamical properties of ecological mutualistic networks. Nature. 2013;500:449–452. doi: 10.1038/nature12438. - DOI - PubMed
    1. Tu C., Suweis S., Grilli J., Formentin M., Maritan A. Reconciling cooperation, biodiversity and stability in complex ecological communities. Sci. Rep. 2019;9:5580. doi: 10.1038/s41598-019-41614-2. - DOI - PMC - PubMed
    1. Ratzke C., Barrere J., Gore J. Strength of species interactions determines biodiversity and stability in microbial communities. Nat. Ecol. Evol. 2020;4:376–383. doi: 10.1038/s41559-020-1099-4. - DOI - PubMed