. 2022 Mar 29;24(4):476.
doi: 10.3390/e24040476.

Epistemic Communities under Active Inference

Affiliations

Epistemic Communities under Active Inference

Mahault Albarracin et al. Entropy (Basel). .

Abstract

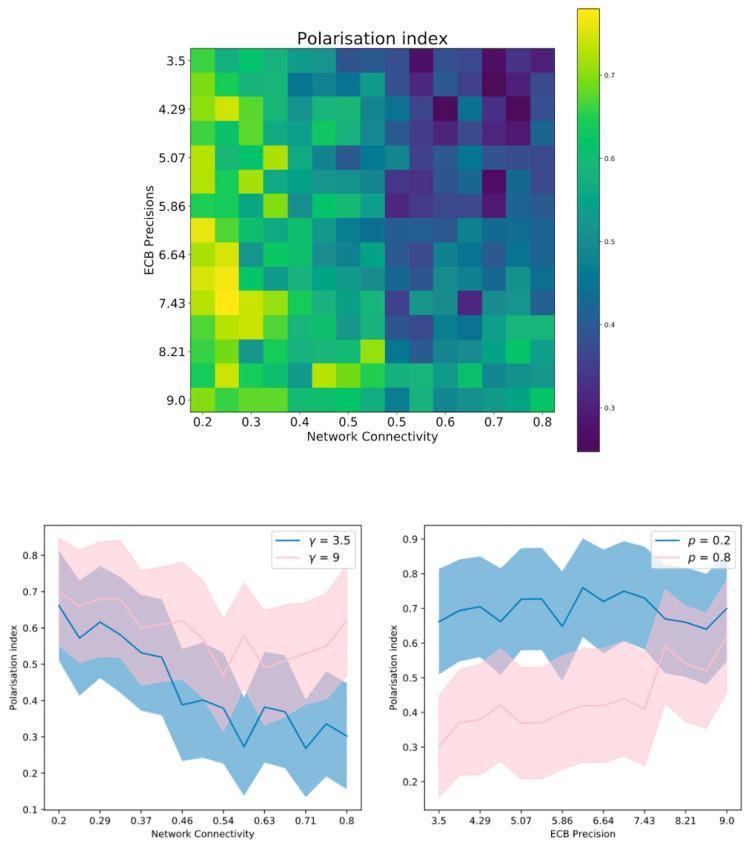
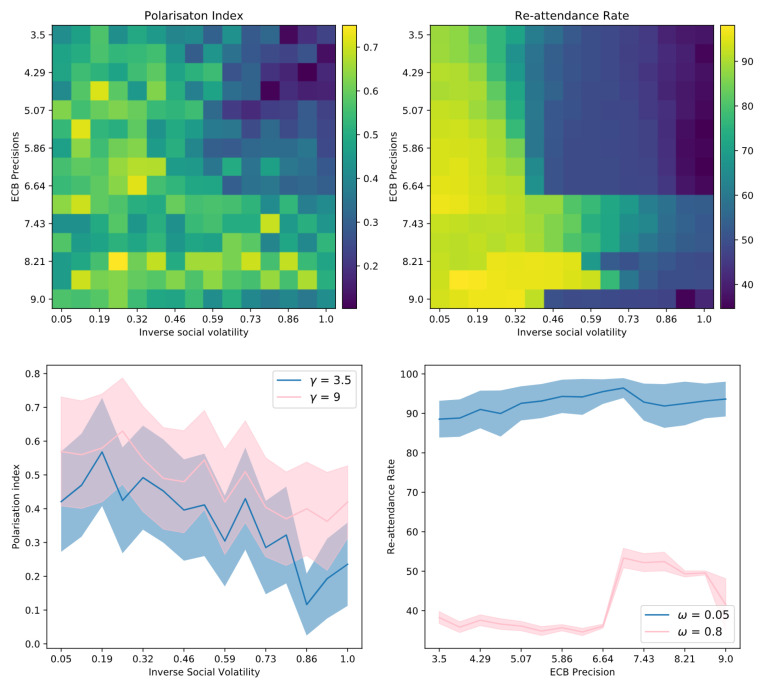
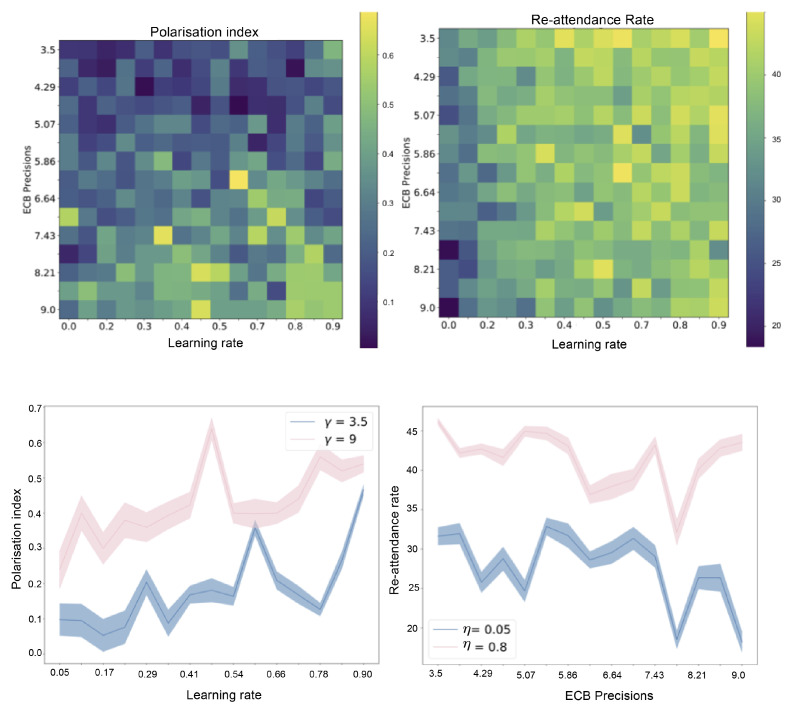
The spread of ideas is a fundamental concern of today's news ecology. Understanding the dynamics of the spread of information and its co-option by interested parties is of critical importance. Research on this topic has shown that individuals tend to cluster in echo-chambers and are driven by confirmation bias. In this paper, we leverage the active inference framework to provide an in silico model of confirmation bias and its effect on echo-chamber formation. We build a model based on active inference, where agents tend to sample information in order to justify their own view of reality, which eventually leads to them to have a high degree of certainty about their own beliefs. We show that, once agents have reached a certain level of certainty about their beliefs, it becomes very difficult to get them to change their views. This system of self-confirming beliefs is upheld and reinforced by the evolving relationship between an agent's beliefs and observations, which over time will continue to provide evidence for their ingrained ideas about the world. The epistemic communities that are consolidated by these shared beliefs, in turn, tend to produce perceptions of reality that reinforce those shared beliefs. We provide an active inference account of this community formation mechanism. We postulate that agents are driven by the epistemic value that they obtain from sampling or observing the behaviours of other agents. Inspired by digital social networks like Twitter, we build a generative model in which agents generate observable social claims or posts (e.g., 'tweets') while reading the socially observable claims of other agents that lend support to one of two mutually exclusive abstract topics. Agents can choose which other agent they pay attention to at each timestep, and crucially who they attend to and what they choose to read influences their beliefs about the world. Agents also assess their local network's perspective, influencing which kinds of posts they expect to see other agents making. The model was built and simulated using the freely available Python package pymdp. The proposed active inference model can reproduce the formation of echo-chambers over social networks, and gives us insight into the cognitive processes that lead to this phenomenon.

Keywords: active inference; epistemic community; opinion dynamics; social media.


Conflict of interest statement

The authors declare no conflict of interest.

Figures

Figure A1
Figure A1
Exploration of the relationship between ‘agreement’ between an agent and one of its neighbours, the epistemic confirmation bias parameter γ, and the epistemic value of reading that neighbour’s tweet content. Here, the two marginal posteriors Q(sIdea) and Q(sMBk) are expressed as two Bernoulli distributions with respective parameters p and q, where ‘agreement’ is the case when p=q and hence (1p)=(1q). The top row shows heatmaps of the negative ambiguity H, entropy H[Q(o)], and the full epistemic value EV=H+H[Q(o)] for a fixed value of γ=15.0, under all possible values of p and q. The ‘epistemic confirmation bias‘ effect is seen in the negative ambiguity surface H (upper left plot), which is maximised when posterior beliefs about the validity of Idea 1, measured by p, are aligned with posterior beliefs about a neighbour’s meta-belief about Idea 1, q. The bottom row of plots shows a complementary perspective, demonstrating the effect of increasing γ on the epistemic value and its components, for different settings of q when p=0.0. The subplot on furthest to the right of the bottom row shows that increasing γ increases epistemic value most when q is on the same side of 0.5 as p (q=0.2,q=0.4), and the effect of γ on epistemic value deceases once q passes 0.5. Note that the epistemic value is 0 when p=q=0, because although the negative ambiguity is maximised in this case, it is counteracted by the entropy term which is 0 since both posteriors are certain.
Figure 1
Figure 1
Bayesian network representation of the POMDP generative model. Squares represent priors, likelihoods, or ‘factors’ that relate random variables to one another, and circles represent random variables (stochastic nodes). Different hidden state factors are represented as state variables and the different modality-specific A(m) arrays of the observation model shown are side by side, since they lead independently to the observations generated in that modality, but are conjunctively dependent on hidden state factors. Note that the B array can be similarly decomposed into different sub-arrays, one per hidden state factor, but it is shown as a single square here for simplicity. The prior over policies is parameterised by E, which has separate prior over control states (EWho and ET) for each control state factor. The box at the top right contains mathematical descriptions of each component in the generative mode. Note that while it is included in the graphical model, we left out the C vector since it is not relevant for the current model.
Figure 2
Figure 2
Belief dynamics and actions of a single agent in response to a sequence of Hashtag observations from two fictive neighbours. Shown are the history of Bernoulli parameters defining three marginal posterior beliefs of the focal agent: the belief about the truth value of Idea 1 (Q(stIdea=Idea1), in red), and its beliefs about the beliefs of its two neighbours regarding Idea 1 (Q(stMB1=Idea1) and Q(stMB2=Idea1), shown in two shades of blue). Through its generative model, the focal agent believes that its Hashtag observations are caused by two neighbour ‘meta-belief’ states. The focal agent is exposed to a sequence of Hashtag observations for 100 timesteps, where in case of attending to the first neighbour (utWho=0), the agent receives observation otNT1=Hashtag 1, otNT2=Null, and in case of sampling the other neighbour (utWho=0), the agent receives observation otNT1=Null, otNT2=Hashtag 2. Due to the ‘Hashtag semantics’ matrix in its generative model, these two Hashtags, respectively, lend evidence for the two levels of sIdea. At each timestep the focal agent performs inferences with respect to hidden states Q(st) as well as policies (control states) Q(ut), and then samples a Neighbour Attendance action from the posterior over control states Q(uWho=0,uWho=1). Below each subplot is a heatmap showing the temporal evolution of the probability of sampling Neighbour 1 vs. Neighbour 2 over time. Subfigure (a) shows an agent with low γ (3.0) and low ωSoc (3.0). The agent’s beliefs about both of their neighbors does not lead it to converge on an idea being true or not. Subfigure (b) shows an agent shows an agent with low γ (3.0) and high ωSoc (9.0). The agent will be more certain about the beliefs of their neighbors, attend less often to their neighbors, quickly converging to neighbour 2. Subfigure (c) shows an agent shows an agent with high γ (9.0) and low ωSoc (3.0). This agent believes in high volatility and will be driven to continue sampling their neighbors, which will lead them to take longer to converge towards an idea. However, given their γ, the agent does converge towards the first sampled idea. Subfigure (d) shows an agent shows an agent with high γ (9.0) and high ωSoc (9.0). This agent believes in low volatility and will be driven to sample the same neighbor very quickly, which will lead them to converge towards an idea quickly.
Figure 3
Figure 3
Collective belief dynamics of multi-agent active inference simulations under different generative model parameterisations. Above each panel are listed the parameter values of γ, ωSoc, and η used in the simulation. Other parameters were fixed with T=50 timesteps, N=30, network connectivity p=0.2, and inverse environmental volatility ωIdea=9.0. At the beginning of each simulation, every agent’s beliefs about Idea 1 were sampled from a uniform distribution over the interval Q(sIdea=Idea1)(0.4,0.6). Each panel displays the evolving beliefs of all agents about Idea 1 (the Bernoulli parameter of each agent’s respective posterior over sIdea), with proximity of the belief to 1.0 indicated by colouring along the green-to-blue spectrum (blue beliefs indicate Q(sIdea=Idea1)>0.5). Panels (A,D) demonstrate polarisation, where two subsets of agents end up believing in two different levels of the Idea hidden state with high certainty. Panels (B,C) on the other hand show examples of consensus, where the whole network converges to the same opinion by the end of the simulation.
Figure 4
Figure 4
The interaction between epistemic confirmation bias and network connectivity in determining collective outcomes. (Top) a heatmap of the mean polarisation index across S=100 independent realisations of the multi-agent opinion dynamics simulations, for unique combinations of network connectivity p and epistemic confirmation bias precision γ. (Bottom) selected line plots show extreme settings of p (p=0.2 and p=0.8) and γ (γ=3.5 and γ=9.0). Shaded areas around each line represent the standard deviation of the polarisation index across independent realisations.
Figure 5
Figure 5
(Above left) a heatmap of the polarisation index for all 225 combinations of inverse belief volatility and epistemic confirmation bias precision. (Above right) a heatmap of the re-attendance rate for all 225 combinations of inverse belief volatility and epistemic confirmation bias precision. (Below left) a line plot of the most extreme rows of the polarisation heatmap. (Below right) a line plot of the most extreme columns of the re-attendance rate heatmap.
Figure 6
Figure 6
(Above left) a heatmap of the polarisation index for all 225 combinations of learning rate and epistemic confirmation bias precision. (Above right) a heatmap of the re-attendance rate for all 225 combinations of learning rate and epistemic confirmation bias precision. The parameters represent the centres of the normal distribution sampled from across trials for each configuration. (Below left) the most extreme row of the polarisation index heatmap. (Below right) the most extreme column of the re-attendance rate heatmap.

Similar articles

Cited by

References

    1. Henrich J. Culture and social behavior. Curr. Opin. Behav. Sci. 2015;3:84–89. doi: 10.1016/j.cobeha.2015.02.001. - DOI
    1. Heerwagen J.H., Orians G.H. Humans, habitats. Biophilia Hypothesis. 1995;138:138–172.
    1. Vasil J., Badcock P.B., Constant A., Friston K., Ramstead M.J. A world unto itself: Human communication as active inference. Front. Psychol. 2020;11:417. doi: 10.3389/fpsyg.2020.00417. - DOI - PMC - PubMed
    1. Goldstein D.G., Gigerenzer G. Models of ecological rationality: The recognition heuristic. Psychol. Rev. 2002;109:75. doi: 10.1037/0033-295X.109.1.75. - DOI - PubMed
    1. Lau R.R., Redlawsk D.P. Advantages and disadvantages of cognitive heuristics in political decision making. Am. J. Political Sci. 2001;45:951–971. doi: 10.2307/2669334. - DOI

LinkOut - more resources