

Assessing the Transmissibility of the New SARS-CoV-2 Variants: From Delta to Omicron
- PMID: 35455246
- PMCID: PMC9026126
- DOI: 10.3390/vaccines10040496
Assessing the Transmissibility of the New SARS-CoV-2 Variants: From Delta to Omicron
Abstract
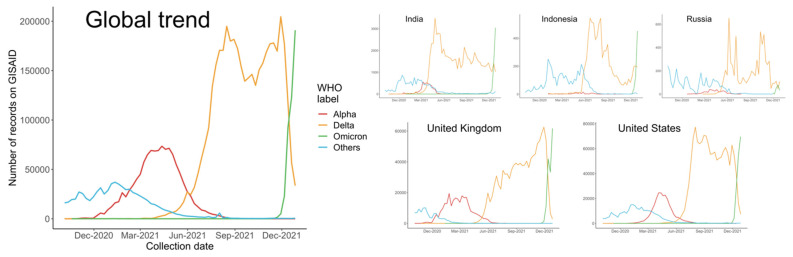
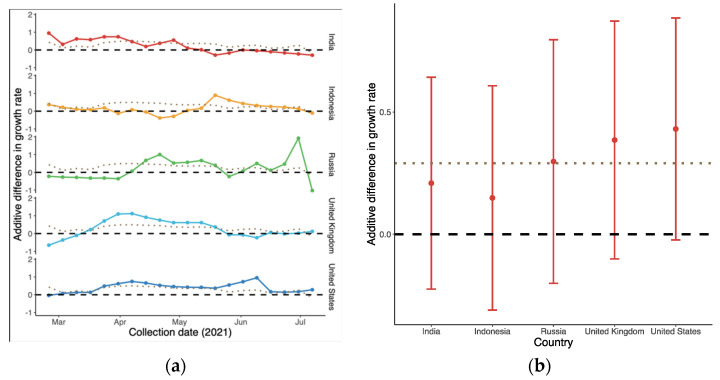
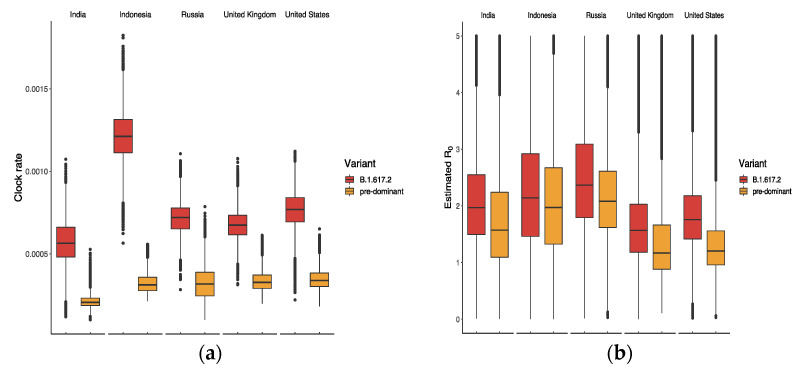
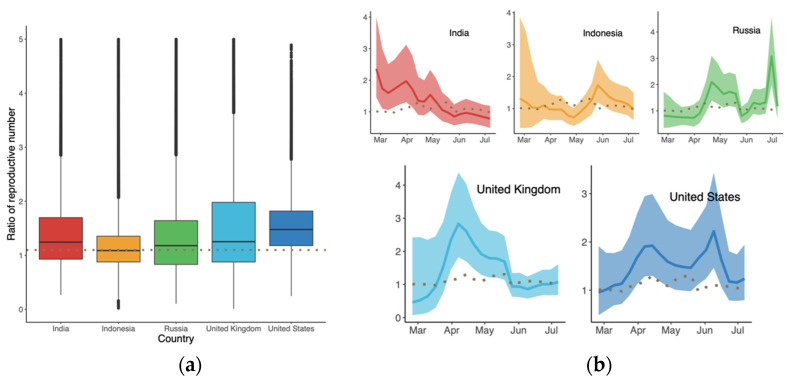
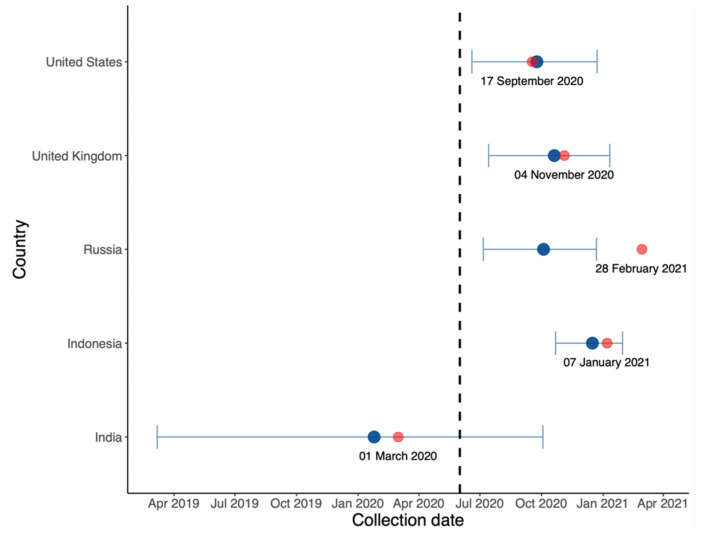
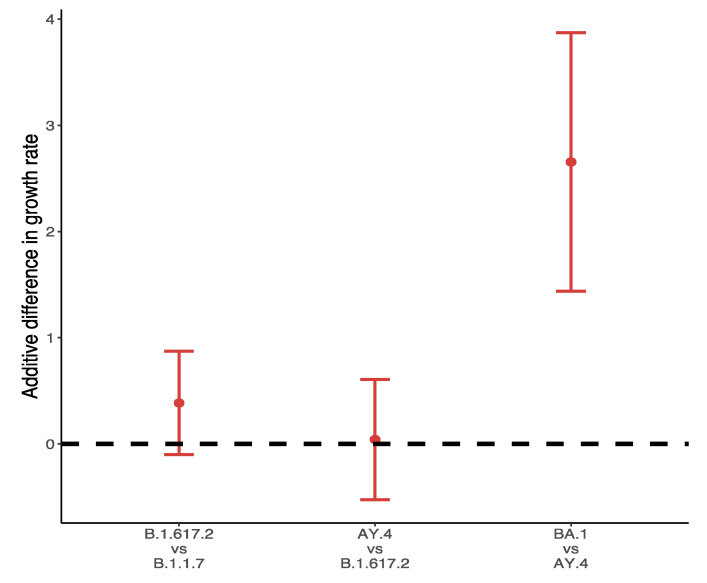
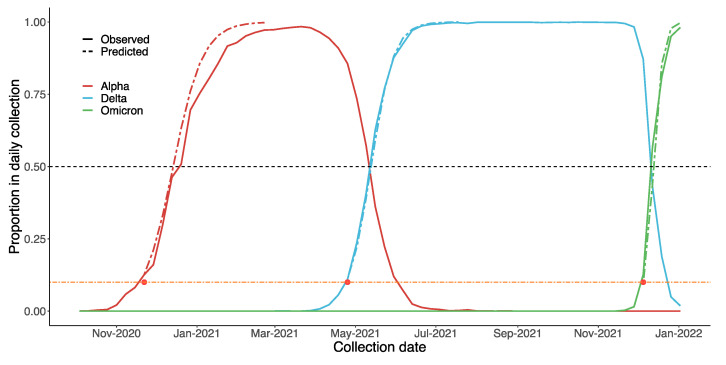
Omicron, the latest SARS-CoV-2 Variant of Concern (VOC), first appeared in Africa in November 2021. At present, the question of whether a new VOC will out-compete the currently predominant variant is important for governments seeking to determine if current surveillance strategies and responses are appropriate and reasonable. Based on both virus genomes and daily-confirmed cases, we compare the additive differences in growth rates and reproductive numbers (R0) between VOCs and their predominant variants through a Bayesian framework and phylo-dynamics analysis. Faced with different variants, we evaluate the effects of current policies and vaccinations against VOCs and predominant variants. The model also predicts the date on which a VOC may become dominant based on simulation and real data in the early stage. The results suggest that the overall additive difference in growth rates of B.1.617.2 and predominant variants was 0.44 (95% confidence interval, 95% CI: -0.38, 1.25) in February 2021, and that the VOC had a relatively high R0. The additive difference in the growth rate of BA.1 in the United Kingdom was 6.82 times the difference between Delta and Alpha, and the model successfully predicted the dominating process of Alpha, Delta and Omicron. Current vaccination strategies remain similarly effective against Delta compared to the previous variants. Our model proposes a reliable Bayesian framework to predict the spread trends of VOCs based on early-stage data, and evaluates the effects of public health policies, which may help us better prepare for the upcoming Omicron variant, which is now spreading at an unprecedented speed.
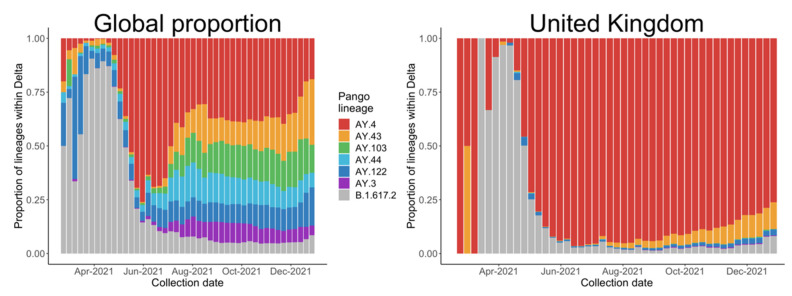
Keywords: AY.4; B.1.617.2; BA.1; Delta variants; Omicron variants; nonpharmaceutical interventions; reproductive number; vaccination.
Conflict of interest statement
The authors declare no conflict of interest.
Figures

Similar articles
-
New Surveillance Metrics for Alerting Community-Acquired Outbreaks of Emerging SARS-CoV-2 Variants Using Imported Case Data: Bayesian Markov Chain Monte Carlo Approach.JMIR Public Health Surveill. 2022 Nov 25;8(11):e40866. doi: 10.2196/40866. JMIR Public Health Surveill. 2022. PMID: 36265134 Free PMC article.
-
Replacement dynamics and the pathogenesis of the Alpha, Delta and Omicron variants of SARS-CoV-2.Epidemiol Infect. 2022 Dec 20;151:e32. doi: 10.1017/S0950268822001935. Epidemiol Infect. 2022. PMID: 36535802 Free PMC article.
-
Has Omicron Changed the Evolution of the Pandemic?JMIR Public Health Surveill. 2022 Jan 31;8(1):e35763. doi: 10.2196/35763. JMIR Public Health Surveill. 2022. PMID: 35072638 Free PMC article.
-
Omicron: What Makes the Latest SARS-CoV-2 Variant of Concern So Concerning?J Virol. 2022 Mar 23;96(6):e0207721. doi: 10.1128/jvi.02077-21. Epub 2022 Mar 23. J Virol. 2022. PMID: 35225672 Free PMC article. Review.
-
Is the SARS CoV-2 Omicron Variant Deadlier and More Transmissible Than Delta Variant?Int J Environ Res Public Health. 2022 Apr 11;19(8):4586. doi: 10.3390/ijerph19084586. Int J Environ Res Public Health. 2022. PMID: 35457468 Free PMC article. Review.
Cited by
-
Analysis of the effect of PCR testing and antigen testing on controlling the transmission for Omicron based on different scenarios.Infect Dis Model. 2023 Jul 24;8(4):939-946. doi: 10.1016/j.idm.2023.07.011. eCollection 2023 Dec. Infect Dis Model. 2023. PMID: 37608880 Free PMC article.
-
A prediction of mutations in infectious viruses using artificial intelligence.Genomics Inform. 2024 Oct 8;22(1):15. doi: 10.1186/s44342-024-00019-y. Genomics Inform. 2024. PMID: 39380083 Free PMC article.
-
Molecular characteristics, immune evasion, and impact of SARS-CoV-2 variants.Signal Transduct Target Ther. 2022 Jun 28;7(1):202. doi: 10.1038/s41392-022-01039-2. Signal Transduct Target Ther. 2022. PMID: 35764603 Free PMC article. Review.
-
Genomic surveillance of genes encoding the SARS-CoV-2 spike protein to monitor for emerging variants on Jeju Island, Republic of Korea.Front Microbiol. 2023 Jul 18;14:1170766. doi: 10.3389/fmicb.2023.1170766. eCollection 2023. Front Microbiol. 2023. PMID: 37533831 Free PMC article.
-
A Small Surge in Incidence of SARS-CoV-2 Omicron Variant in the "Dynamic Zero" Period.Can J Infect Dis Med Microbiol. 2023 Mar 13;2023:5262117. doi: 10.1155/2023/5262117. eCollection 2023. Can J Infect Dis Med Microbiol. 2023. PMID: 36950085 Free PMC article.
References
-
- Centers for Disease Control and Prevention Variant Proportions. [(accessed on 26 December 2021)];2021 Available online: https://covid.cdc.gov/covid-data-tracker/#variant-proportions.
Grants and funding
LinkOut - more resources
Full Text Sources
Miscellaneous
