. 2022 Apr 11;15(4):461.
doi: 10.3390/ph15040461.

Transcriptomic Analysis of Fumarate Compounds Identifies Unique Effects of Isosorbide Di-(Methyl Fumarate) on NRF2, NF-kappaB and IRF1 Pathway Genes

Affiliations

Transcriptomic Analysis of Fumarate Compounds Identifies Unique Effects of Isosorbide Di-(Methyl Fumarate) on NRF2, NF-kappaB and IRF1 Pathway Genes

William R Swindell et al. Pharmaceuticals (Basel). .

Abstract

Dimethyl fumarate (DMF) has emerged as a first-line therapy for relapsing-remitting multiple sclerosis (RRMS). This treatment, however, has been limited by adverse effects, which has prompted development of novel derivatives with improved tolerability. We compared the effects of fumarates on gene expression in astrocytes. Our analysis included diroximel fumarate (DRF) and its metabolite monomethyl fumarate (MMF), along with a novel compound isosorbide di-(methyl fumarate) (IDMF). Treatment with IDMF resulted in the largest number of differentially expressed genes. The effects of DRF and MMF were consistent with NRF2 activation and NF-κB inhibition, respectively. IDMF responses, however, were concordant with both NRF2 activation and NF-κB inhibition, and we confirmed IDMF-mediated NF-κB inhibition using a reporter assay. IDMF also down-regulated IRF1 expression and IDMF-decreased gene promoters were enriched with IRF1 recognition sequences. Genes altered by each fumarate overlapped significantly with those near loci from MS genetic association studies, but IDMF had the strongest overall effect on MS-associated genes. These results show that next-generation fumarates, such as DRF and IDMF, have effects differing from those of the MMF metabolite. Our findings support a model in which IDMF attenuates oxidative stress via NRF2 activation, with suppression of NF-κB and IRF1 contributing to mitigation of inflammation and pyroptosis.

Keywords: Interferon regulatory factor; NF-kappaB; NRF2; astrocyte; dimethyl fumarate; diroximel fumarate; glial cells; multiple sclerosis; neurodegeneration; neuroinflammation.


Conflict of interest statement

WRS has received consulting reimbursement from Sytheon, Ltd., which provided funding for this study. WRS is a Symbionyx Pharmaceuticals shareholder and member of the Symbionyx advisory board. KB is CEO of Sunny BioDiscovery, Inc. (Santa Paula, CA, USA), has received consulting reimbursement from Sytheon, Ltd., and is Chief Scientific Officer of Symbionyx Pharmaceuticals. RKC is CEO and founder of Sytheon, Ltd., and Symbionyx Pharmaceuticals, with ownership interest in both companies. KB and RKC are listed as inventors of IDMF on composition of matter and application patents (US 10,597,402 and EP 3503866).

Figures
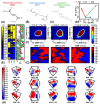
Figure 1
Figure 1
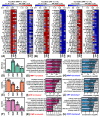
Differential expression comparison (MMF vs. DRF vs. IDMF). (AC) Fumarate compound molecular structures. (D) PC differential expression vectors. Arrows start at the CTL treatment (bivariate mean) and terminate at the bivariate mean for each treatment (MMF, DRF, or IDMF). Longer arrows correspond to a stronger treatment effect. (E) Heatmap. FC change estimates are shown for the top-ranked 50% of genes (n = 6493) having the largest absolute FC estimate (|FC|) among the three differential expression comparison. (F) Scatterplots. FC estimates are plotted to compare effects of MMF, DRF, and IDMF. The density of genes in each region is indicated (see color scale) and the Spearman correlation coefficient and p-value are shown (top margin). (G) Self-organizing maps (SOMs). Genes were assigned to regions within an SOM and the average fold-change of genes within each region is shown (see color scale). (H) SOM surface plots. The three-dimensional surface indicates the average FC among genes assigned to each SOM region. Plots are shown with varying rotations for viewing at multiple angles (45, 90, 135, 180, and 225 degrees).
Figure 2
Figure 2
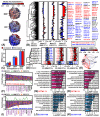
Top-ranked DEGs. (AC) Top 30 DEGs most strongly altered by (A) MMF, (B) DRF, and (C) IDMF. The top-ranked 30 increased and decreased genes are shown for each compound (i.e., lowest p-values with FC > 1.25 or FC < 0.80). (D) NFATC2. (E) SACM1L. (F) ACTR3. In (DF), average expression (log2 scale) is shown for each treatment (±1 standard error; * p < 0.05, comparison to CTL treatment). Expression is normalized to the average value in the CTL treatment for each gene. (GL) GO BP terms enriched among (G,I,K) increased and (H,J,L) decreased DEGs. The number of DEGs associated with each GO term is given in parentheses (left margin) and example DEGs are listed within each figure.
Figure 3
Figure 3
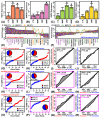
Gene expression module analysis. (A) Module co-expression networks. Each vertex represents one of 234 modules. Connections are drawn between modules for which medoids are correlated (rs ≥ 0.80). Vertex color reflects the average FC of module genes. Edge color reflects the average FC of the two modules joined. (B) Module cluster analysis. The 234 module medoids were clustered based upon the Euclidean distance (normalized to the [0, 1] interval). Average FC for each module is shown and module IDs are listed (right margin). (C) Number of differentially expressed modules (DEMs) for each comparison (MMF vs. CTL, DRF cv. CTL, IDMF vs. CTL). (D) IDMF-responsive modules (cluster analysis). The 10 modules most strongly altered by IDMF are shown. Cluster analysis was performed using Euclidean distance (normalized to the [0, 1] interval). Boxplots outline the middle 50% of FC estimates for each module (whiskers: 10th to 90th percentiles). (E) IDMF-responsive modules (network). The 10 modules from (D) are shown (vertex labels are abbreviated). Network parameters and color-coding are as described for part (A) above. (F) Module DCTN1-74 genes. The 16 genes most strongly increased by IDMF are shown (i.e., lowest p-values). (G) GO BP terms enriched among module DCTN1-74 genes. (H) GO CC terms enriched among module DCTN1-74 genes. (I) Module SLC8A1-109 genes. The 16 genes most strongly decreased by IDMF are shown (i.e., lowest p-values). (J) GO BP terms enriched among module SLC8A1-109 genes. (K) GO CC terms enriched among module SLC8A1-109 genes. In (G,H,J,K), the number of genes associated with each term is listed in parentheses (left margin) and example genes are listed within the figure.
Figure 4
Figure 4
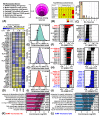
NRF2 target genes. (A) NQO1. (B) HMOX1. (C) G6PD. (D) TXNRD1. In (AD), average expression (log2 scale) is shown for each treatment (± 1 standard error; * p < 0.05, comparison to CTL treatment). Expression is normalized to the average value in the CTL treatment for each gene. (E) NRF2-increased genes. (F) NRF2-decreased genes. In (E,F), the value of |FC|max was calculated for each gene, where |FC|max is defined as max [abs(FCMMF, FCDRF, FCIDMF)], and the 23 NRF2-increased or NRF2-decreased genes with highest value of |FC|max are shown. Non-black gene labels are used if there is significant differential expression (p < 0.05) for any of the three comparisons, in which case the label color matches the comparison associated with the lowest differential expression p-value. (G,H,K,L,O,P) FC estimates for NRF2-responsive genes. FC estimates are plotted and the proportion of fumarate-increased (red) fumarate-decreased (blue) genes is shown (p-value: Fisher’s exact test). The percentage of increased/decreased genes is also indicated (see legend). (I,J,M,N,Q,R) The cumulate overlap is shown between NRF2-regulated genes and genes ranked based upon their response to each fumarate compound. A positive area statistic denotes enrichment among fumarate-increased genes, and a negative area statistic indicates enrichment among fumarate-decreased genes (p-value: Wilcoxon rank sum test).
Figure 5
Figure 5
NF-kB (RELA) target genes. (A) NFKBIA. (B) TNFAIP3. (C) BCL2L1. (D) ICAM1. In (AD), average expression (log2 scale) is shown for each treatment (±1 standard error; * p < 0.05, comparison to CTL treatment). Expression is normalized to the average value in the CTL treatment for each gene. (E) RELA-activated genes. (F) RELA-suppressed genes. In (E,F), the value of |FC|max was calculated for each gene, where |FC|max is defined as max [abs(FCMMF, FCDRF, FCIDMF)], and the 23 RELA-activated or RELA-suppressed genes with highest value of |FC|max are shown. Non-black gene labels are used if there is significant differential expression (p < 0.05) for any of the three comparisons, in which case the label color matches the comparison associated with the lowest differential expression p-value. (G,H,K,L,O,P) FC estimates for RELA-activated genes. FC estimates are plotted and the proportion of fumarate-increased (red) fumarate-decreased (blue) genes is shown (p-value: Fisher’s exact test). The percentage of increased/decreased genes is also indicated (see legend). (I,J,M,N,Q,R) The cumulate overlap is shown between RELA-activated genes and genes ranked based upon their response to each fumarate compound. A positive area statistic denotes enrichment among fumarate-increased genes, and a negative area statistic indicates enrichment among fumarate-decreased genes (p-value: Wilcoxon rank sum test).
Figure 6
Figure 6
MS-associated genes. (A) MS gene databases. (B) Top MS-associated genes (six or more database sources). (C) Number of sources for MS-associated genes. (D) MS-associated genes (four or more sources) and their response to MMF, DRF, and IDMF. The 40 genes most strongly altered by one of the three compounds are shown (i.e., lowest p-value). (E,G,I) Average absolute FC (|log2(FC)|) of MS-associated genes (four or more sources). The null distribution shown was obtained by calculating the absolute FC in randomly sampled gene sets of the same size (10,000 simulation trials). (F,H,J) MS-associated genes most strongly altered by each compound (four or more sources). The number of database sources linking each to MS is shown in parentheses. Significantly altered genes (p < 0.05) are shown in red (increased) or blue (decreased) font. (K,L) GO BP terms enriched among MS-associated genes (three or more sources) altered by IDMF (p < 0.05 with FC > 1.25 or FC < 0.80). The number of genes associated with each GO BP term is indicated in parentheses (left margin) and example genes are listed within each figure.
Figure 7
Figure 7
MS-associated genes from GWAS studies and their overlap with DEGs. (A,E,I) Overlap between DEGs and MS-associated genes from the NHGRI-EBI GWAS Catalog (reported, mapped, upstream, or downstream). DEGs were identified based on the same threshold in each analysis (p < 0.05, FC > 1.25 or FC < 0.80; bottom p-value: Fisher’s exact test for overlap). (B,F,J) Genes at varying distances from MS GWAS loci (horizontal axis) and their overlap with the top 30 genes most strongly increased/decreased by MMF, DRF, or IDMF (black line: overlap with respect to all other genes). Cases of significant overlap are indicated in the top margin (p < 0.05, Fisher’s exact test). (C,D,G,H,K,L) Average distance between the top 30 genes most strongly altered by MMF, DRF, or IDMF and the nearest MS GWAS locus (arrow). The distribution is obtained from 1000 simulation trials in which 30 genes were selected at random, with the average distance to the nearest MS GWAS locus calculated in each trial. (M,N) IDMF-increased/decreased genes nearest to an MS GWAS locus. For each gene, the distance to the nearest MS GWAS locus is shown (left) along with estimated fold-change (IDMF/CTL) (right). (OR) Selected IDMF-responsive genes near MS GWAS loci. Average expression (±1 standard error) is shown for each treatment (* p < 0.05, comparison to CTL).
Figure 8
Figure 8
RT-PCR analyses and NF-κB luciferase reporter assay. (AG) RT-PCR analyses (OSGIN1, IL6, ICAM1, MALT1, TNFAIP3, IRF1, and CXCL8). Average relative expression is shown for each gene (±1 standard error; n = 3 replicates per treatment). Relative expression was calculated using the 2−∆∆Ct method and ∆Ct values were further normalized to the CTL treatment. Average relative expression is shown for each treatment (bottom margin). Treatments with different letters have significantly different average expression (p < 0.05, Fisher’s least significant difference). (H) NF-κB reporter assay. Human fetal astrocytes were transfected with firefly/Renilla luciferase constructs and treated with TNF-α (20 ng/ml) alone (n = 6) or TNF-α (20 ng/mL) + IDMF (2.5 µM) (n = 3) for 6 h. The ratio of luciferase and Renilla (internal control) signals was used to monitor NF-κB induction. The average ratio value is shown (±1 standard error) for each treatment (p-value: two-sample Wilcoxon rank sum test).
Figure 9
Figure 9
IDMF hypothesized mechanisms of therapeutic effect. IDMF activates NRF2-dependent signaling (red arrows) while inhibiting NF-κB activity and transcription of downstream genes (blue). IDMF triggers dissociation of NRF2 from KEAP1 to allow nuclear translocation of NRF2. Nuclear NRF2 dimerizes with musculoaponeurotic fibrosarcoma (Maf) and binds antioxidant response elements (ARE) to induce the transcription of target genes, such as HMOX1. The HMOX1 protein then acts as an enzyme to catalyze the formation of antioxidants such as bilirubin and biliverdin, while also inhibiting nitric oxide synthase (NOS). Together, these effects of HMOX1 reduce accumulation of reactive oxygen and reactive nitrogen species (ROS and RNS) to attenuate oxidative stress. The inhibition of NF-κB by IDMF prevents nuclear translocation and up-regulation of target genes such as ICAM1, CXCL8, IL6, and IRF1. Reduced expression of these targets leads to reduced inflammation via attenuation of ICAM1-dependent leukocyte adhesion, cytokine production with cytokine storm, and IRF1/CASP4-dependent inflammasome activation. Overall dampening of these inflammatory processes inhibits pyroptosis and, thus, limits progression of demyelination. See text for details. (Figure created with BioRender.com).

Similar articles

Cited by

References

    1. Reich D.S., Lucchinetti C.F., Calabresi P.A. Multiple Sclerosis. N. Engl. J. Med. 2018;378:169–180. doi: 10.1056/NEJMra1401483. - DOI - PMC - PubMed
    1. Walton C., King R., Rechtman L., Kaye W., Leray E., Marrie R.A., Robertson N., La Rocca N., Uitdehaag B., van der Mei I., et al. Rising prevalence of multiple sclerosis worldwide: Insights from the Atlas of MS, third edition. Mult. Scler. J. 2020;26:1816–1821. doi: 10.1177/1352458520970841. - DOI - PMC - PubMed
    1. Wallin M.T., Culpepper W.J., Nichols E., Bhutta Z.A., Gebrehiwot T.T., Hay S.I., Khalil I.A., Krohn K.J., Liang X., Naghavi M., et al. Global, regional, and national burden of multiple sclerosis 1990–2016: A systematic analysis for the Global Burden of Disease Study 2016. Lancet. Neurol. 2019;18:269–285. doi: 10.1016/S1474-4422(18)30443-5. - DOI - PMC - PubMed
    1. Simpson S., Jr., Wang W., Otahal P., Blizzard L., van der Mei I.A.F., Taylor B.V. Latitude continues to be significantly associated with the prevalence of multiple sclerosis: An updated meta-analysis. J. Neurol. Neurosurg. Psychiatry. 2019;90:1193–1200. doi: 10.1136/jnnp-2018-320189. - DOI - PubMed
    1. Ortiz G.G., Pacheco-Moisés F.P., Macías-Islas M., Flores-Alvarado L.J., Mireles-Ramírez M.A., González-Renovato E.D., Hernández-Navarro V.E., Sánchez-López A.L., Alatorre-Jiménez M.A. Role of the blood-brain barrier in multiple sclerosis. Arch. Med. Res. 2014;45:687–697. doi: 10.1016/j.arcmed.2014.11.013. - DOI - PubMed