. 2022 Apr 15;15(4):484.
doi: 10.3390/ph15040484.

Growth Differentiation Factor-15 Correlates Inversely with Protease-Activated Receptor-1-Mediated Platelet Reactivity in Patients with Left Ventricular Assist Devices

Affiliations

Growth Differentiation Factor-15 Correlates Inversely with Protease-Activated Receptor-1-Mediated Platelet Reactivity in Patients with Left Ventricular Assist Devices

Maximilian Tscharre et al. Pharmaceuticals (Basel). .

Abstract

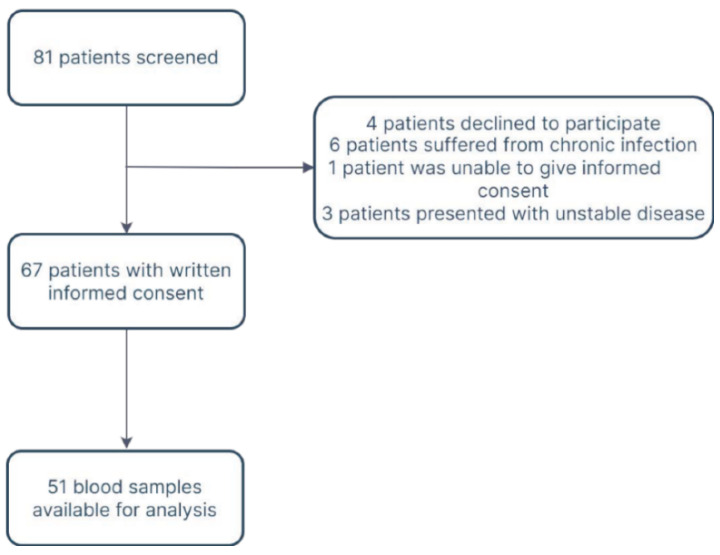
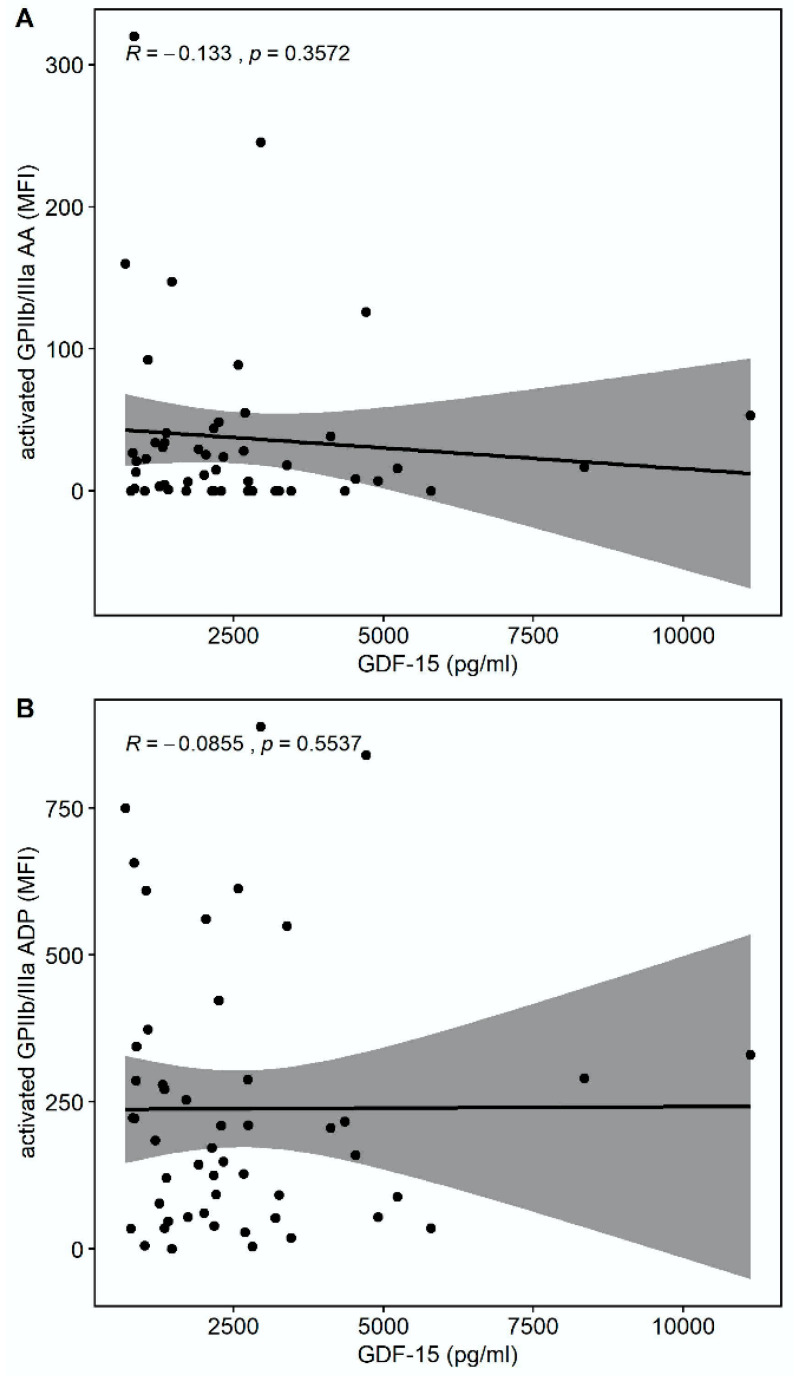
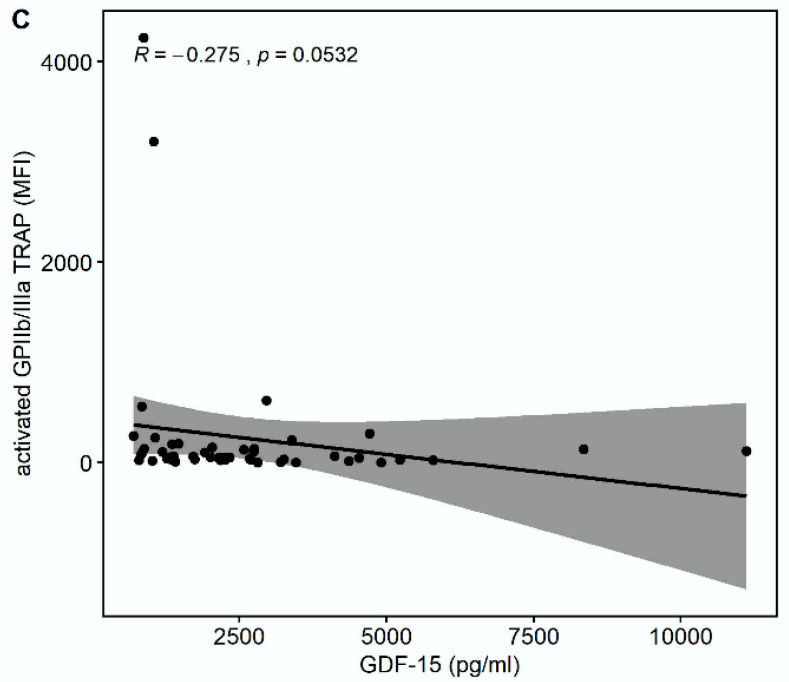
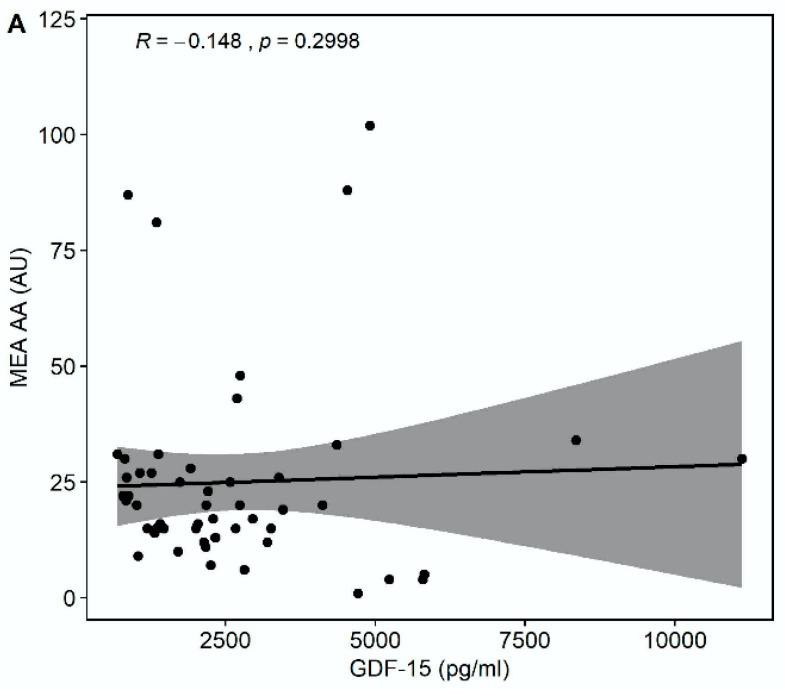
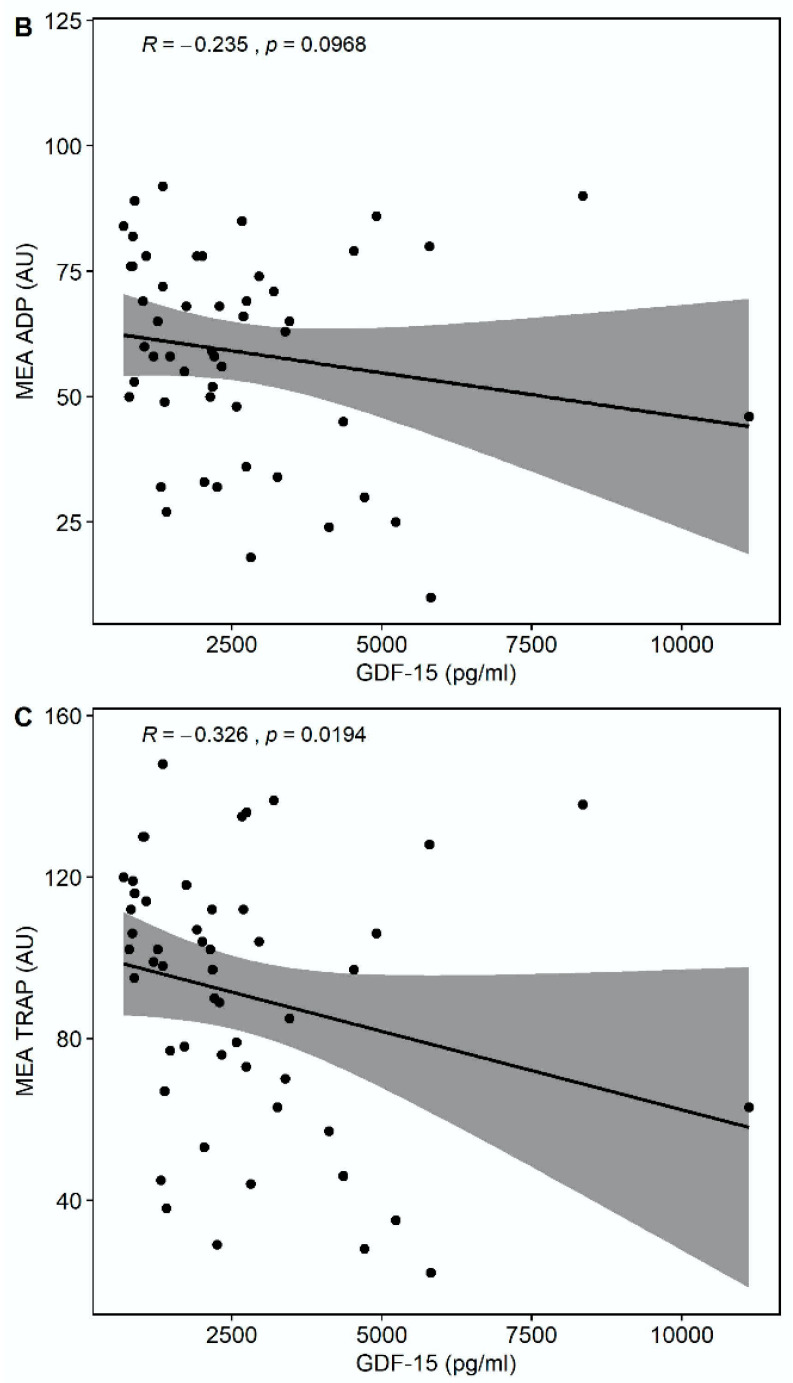
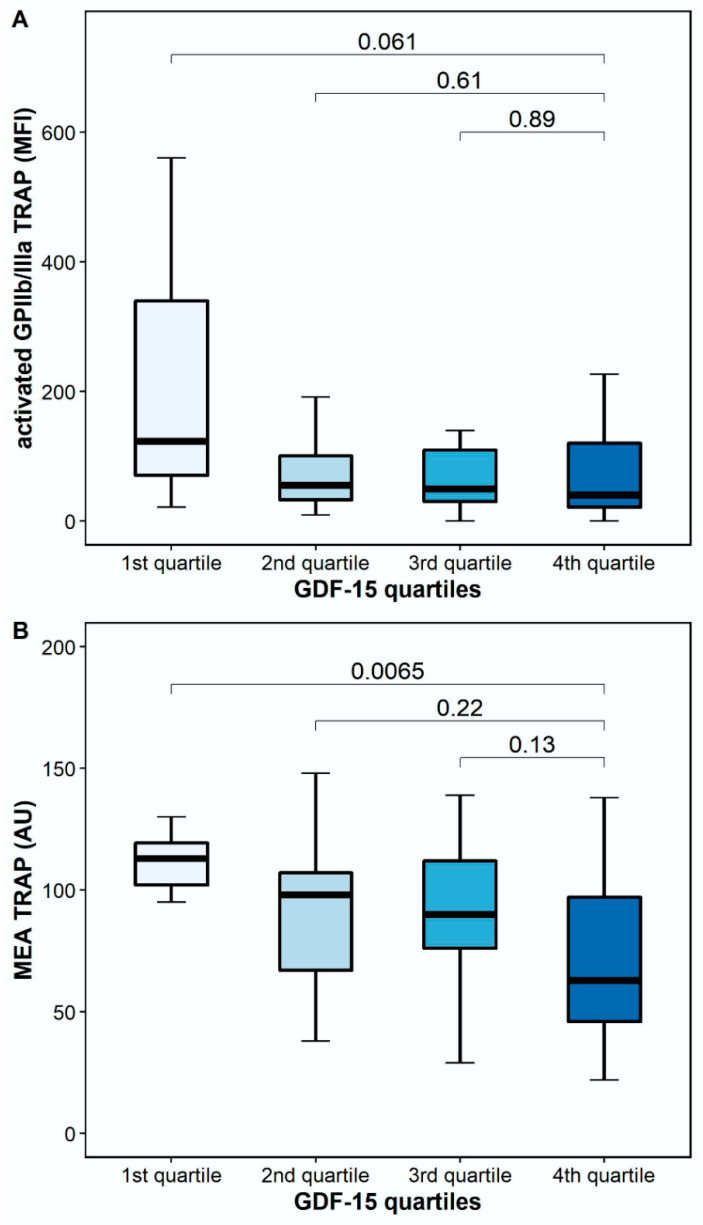
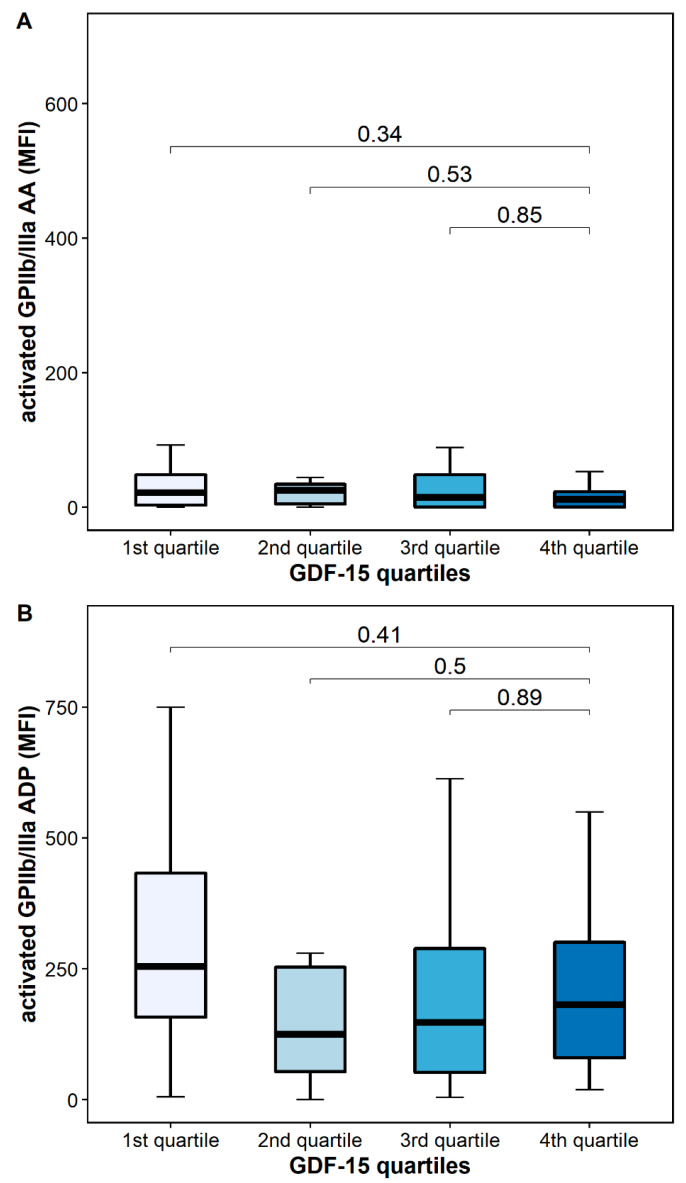
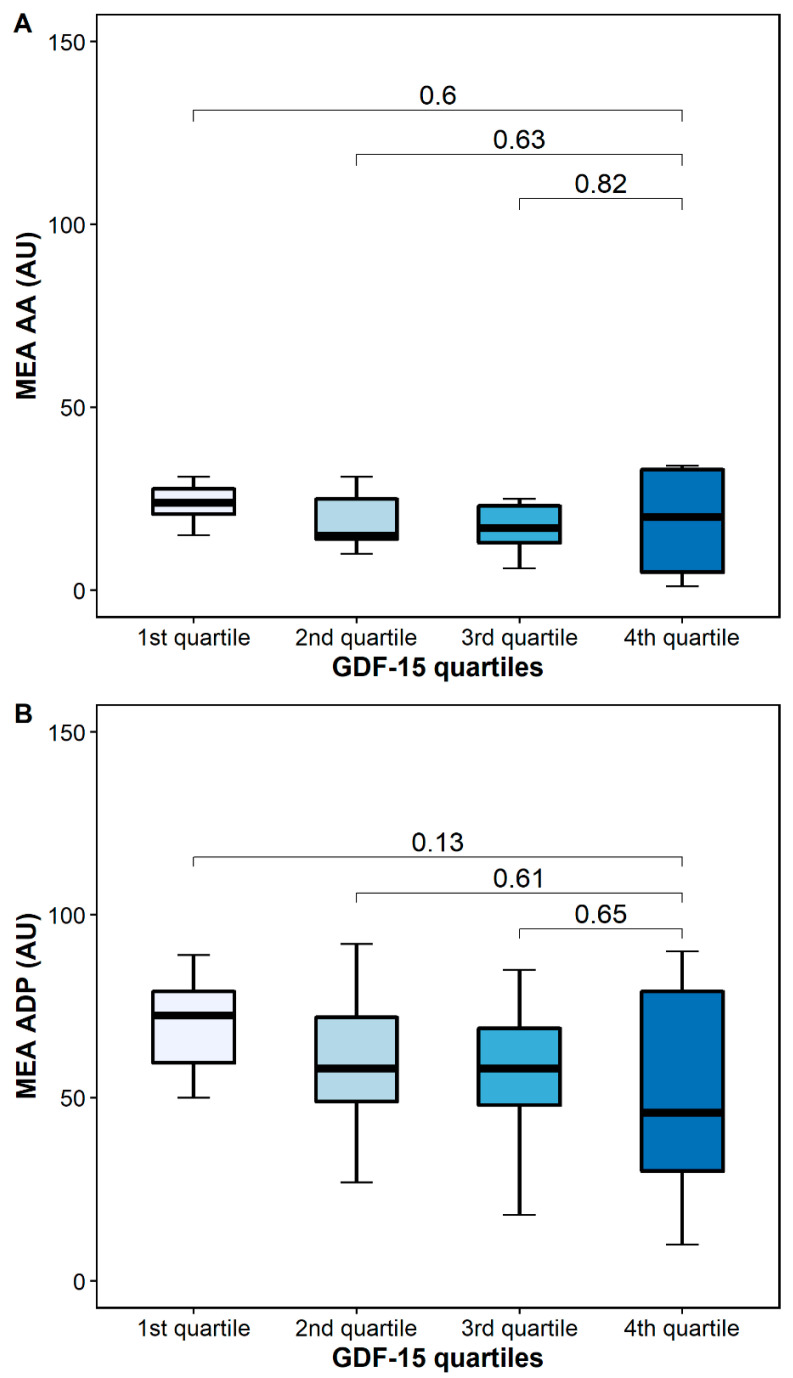
Growth differentiation factor (GDF)-15 inhibits platelet activation, prevents thrombus formation, and has been linked to bleeding events. This was a prospective study including 51 left-ventricular assist device (LVAD) patients on aspirin and phenprocoumon. Platelet surface expression of activated glycoprotein (GP) IIb/IIIa was assessed by flow cytometry, and platelet aggregation was measured by multiple electrode aggregometry (MEA) in response to arachidonic acid (AA), adenosine diphosphate (ADP), and thrombin receptor-activating peptide (TRAP), a protease-activated-receptor-1 (PAR-1) agonist. GDF-15 was determined with a commercially-available assay. There was a trend towards an inverse correlation of GDF-15 with activated GPIIb/IIIa in response to TRAP (r = -0.275, p = 0.0532) but not in response to AA and ADP. Moreover, GDF-15 correlated with MEA TRAP (r = -0.326, p = 0.0194), whereas it did not correlate with MEA ADP and MEA AA. In a second step, GDF-15 levels in the fourth quartile were defined as high GDF-15. Patients with high GDF-15 showed significantly lower TRAP-inducible platelet aggregation by MEA compared to patients in the first quartile (63 AU vs. 113 AU, p = 0.0065). In conclusion, in LVAD patients receiving state-of-the-art antithrombotic therapy, GDF-15 correlates inversely with residual platelet reactivity via PAR-1.

Keywords: GDF-15; GPIIb/IIIa; LVAD; PAR-1; multiple electrode aggregometry.


Conflict of interest statement

D.W. is a consultant and proctor for Abbott and Medtronic. D.Z. receives research grants from Abbott and Medtronic, is an advisory board member for Abbott, Medtronic, and Berlin Heart, and is a proctor for Abbott and Medtronic. The other authors have no conflict of interest to declare.

Figures

Figure 1
Figure 1
Flow diagram.
Figure 2
Figure 2
Correlations of GDF-15 with the platelet surface expression of activated glycoprotein (GP) IIb/IIIa. (A) Scatter plot showing GDF-15 (x-axis) versus activated GPIIb/IIIa in response to arachidonic acid (AA) (y-axis). (B) Scatter plot showing GDF-15 (x-axis) versus activated GPIIb/IIIa in response to adenosine diphosphate (ADP) (y-axis). (C) Scatter plot showing GDF-15 (x-axis) versus activated GPIIb/IIIa in response to thrombin receptor-activating peptide (TRAP) (y-axis).
Figure 2
Figure 2
Correlations of GDF-15 with the platelet surface expression of activated glycoprotein (GP) IIb/IIIa. (A) Scatter plot showing GDF-15 (x-axis) versus activated GPIIb/IIIa in response to arachidonic acid (AA) (y-axis). (B) Scatter plot showing GDF-15 (x-axis) versus activated GPIIb/IIIa in response to adenosine diphosphate (ADP) (y-axis). (C) Scatter plot showing GDF-15 (x-axis) versus activated GPIIb/IIIa in response to thrombin receptor-activating peptide (TRAP) (y-axis).
Figure 3
Figure 3
Correlations of GDF-15 with platelet aggregation by multiple electrode aggregometry (MEA). (A) Scatter plot showing GDF-15 (x-axis) versus arachidonic acid (AA)-inducible platelet aggregation by MEA (y-axis). (B) Scatter plot showing GDF-15 (x-axis) versus adenosine diphosphate (ADP)-inducible platelet aggregation by MEA (y-axis). (C) Scatter plot showing GDF-15 (x-axis) versus thrombin receptor-activating peptide (TRAP)-inducible platelet aggregation by MEA (y-axis).
Figure 3
Figure 3
Correlations of GDF-15 with platelet aggregation by multiple electrode aggregometry (MEA). (A) Scatter plot showing GDF-15 (x-axis) versus arachidonic acid (AA)-inducible platelet aggregation by MEA (y-axis). (B) Scatter plot showing GDF-15 (x-axis) versus adenosine diphosphate (ADP)-inducible platelet aggregation by MEA (y-axis). (C) Scatter plot showing GDF-15 (x-axis) versus thrombin receptor-activating peptide (TRAP)-inducible platelet aggregation by MEA (y-axis).
Figure 4
Figure 4
Platelet reactivity in response to thrombin receptor-activating peptide (TRAP) according to GDF-15 quartiles. (A) Activated GPIIb/IIIa in response to TRAP according to GDF-15 quartiles. (B) TRAP-inducible platelet aggregation by multiple electrode aggregometry according to GDF-15 quartiles. The boundaries of the box show the lower and upper quartile of data, and the line inside the box represents the median. Whiskers were drawn from the edge of the box to the highest and lowest values that are outside the box but within 1.5 times the box length. The outliers are not presented.
Figure 5
Figure 5
Platelet activation according to GDF-15 quartiles. (A) Activated GPIIb/IIIa in response to arachidonic acid (AA). (B) Activated GPIIb/IIIa in response to adenosine diphosphate (ADP). The boundaries of the box show the lower and upper quartile of data, and the line inside the box represents the median. Whiskers were drawn from the edge of the box to the highest and lowest values that are outside the box but within 1.5 times the box length.
Figure 6
Figure 6
Platelet aggregation by multiple electrode aggregometry (MEA) according to GDF-15 quartiles. (A) Arachidonic acid-inducible platelet aggregation by multiple electrode aggregometry. (B) Adenosine diphosphate (ADP)-inducible platelet aggregation by multiple electrode aggregometry. The boundaries of the box show the lower and upper quartiles of data, and the line inside the box represents the median. Whiskers were drawn from the edge of the box to the highest and lowest values that are outside the box but within 1.5 times the box length.

Similar articles

Cited by

References

    1. Kirklin J.K., Naftel D.C., Pagani F.D., Kormos R.L., Stevenson L.W., Blume E.D., Myers S.L., Miller M.A., Baldwin J.T., Young J.B. Seventh INTERMACS Annual Report: 15,000 Patients and Counting. J. Heart Lung Transplant. 2015;34:1495–1504. doi: 10.1016/j.healun.2015.10.003. - DOI - PubMed
    1. Maltais S., Kilic A., Nathan S., Keebler M., Emani S., Ransom J., Katz J.N., Sheridan B., Brieke A., Egnaczyk G., et al. PREVENtion of HeartMate II Pump Thrombosis Through Clinical Management: The PREVENT Multi-Center Study. J. Heart Lung Transplant. 2017;36:1–12. doi: 10.1016/j.healun.2016.10.001. - DOI - PubMed
    1. Potapov E.V., Antonides C., Crespo-Leiro M.G., Combes A., Färber G., Hannan M.M., Kukucka M., De Jonge N., Loforte A., Lund L.H., et al. 2019 EACTS Expert Consensus on Long-Term Mechanical Circulatory Support. Eur. J. Cardio Thorac. Surg. 2019;56:230–270. doi: 10.1093/ejcts/ezz098. - DOI - PMC - PubMed
    1. Bootcov M.R., Bauskin A.R., Valenzuela S.M., Moore A.G., Bansal M., He X.Y., Zhang H.P., Donnellan M., Mahler S., Pryor K., et al. MIC-1, a Novel Macrophage Inhibitory Cytokine, Is a Divergent Member of the TGF-β Superfamily. Proc. Natl. Acad. Sci. USA. 1997;94:11514–11519. doi: 10.1073/pnas.94.21.11514. - DOI - PMC - PubMed
    1. Farhan S., Freynhofer M.K., Brozovic I., Bruno V., Vogel B., Tentzeris I., Baumgartner-Parzer S., Huber K., Kautzky-Willer A. Determinants of Growth Differentiation Factor 15 in Patients with Stable and Acute Coronary Artery Disease. A Prospective Observational Study. Cardiovasc. Diabetol. 2016;15:60. doi: 10.1186/s12933-016-0375-8. - DOI - PMC - PubMed

LinkOut - more resources