. 2022 Apr 9;11(8):1280.
doi: 10.3390/cells11081280.

Live-Cell Imaging of the Contractile Velocity and Transient Intracellular Ca2+ Fluctuations in Human Stem Cell-Derived Cardiomyocytes

Affiliations

Live-Cell Imaging of the Contractile Velocity and Transient Intracellular Ca2+ Fluctuations in Human Stem Cell-Derived Cardiomyocytes

Aviseka Acharya et al. Cells. .

Abstract

Live-cell imaging techniques are essential for acquiring vital physiological and pathophysiological knowledge to understand and treat heart disease. For live-cell imaging of transient alterations of [Ca2+]i in human cardiomyocytes, we engineered human-induced pluripotent stem cells carrying a genetically-encoded Ca2+-indicator (GECI). To monitor sarcomere shortening and relaxation in cardiomyocytes in real-time, we generated a α-cardiac actinin (ACTN2)-copepod (cop) green fluorescent protein (GFP+)-human-induced pluripotent stem cell line by using the CRISPR-Cas9 and a homology directed recombination approach. The engineered human-induced pluripotent stem cells were differentiated in transgenic GECI-enhanced GFP+-cardiomyocytes and ACTN2-copGFP+-cardiomyocytes, allowing real-time imaging of [Ca2+]i transients and live recordings of the sarcomere shortening velocity of ACTN2-copGFP+-cardiomyocytes. We developed a video analysis software tool to quantify various parameters of sarcoplasmic Ca2+ fluctuations recorded during contraction of cardiomyocytes and to calculate the contraction velocity of cardiomyocytes in the presence and absence of different drugs affecting cardiac function. Our cellular and software tool not only proved the positive and negative inotropic and lusitropic effects of the tested cardioactive drugs but also quantified the expected effects precisely. Our platform will offer a human-relevant in vitro alternative for high-throughput drug screenings, as well as a model to explore the underlying mechanisms of cardiac diseases.

Keywords: CRISPR-Cas9; contractile velocity of cardiomyocytes; drug screening; genetically encoded Ca2+-indicator; hiPSCs.


Conflict of interest statement

The authors declare no conflict of interest.

Figures

Figure 1
Figure 1
Generation of Tet-inducible GECI-eGFP+-hiPSCs -enhanced green fluorescent protein (eGFP+)-human-induced pluripotent stem cell (hiPSCs) for live calcium flux measurements in hiPSC-cardiomyocytes (CMs). GCaMP6 is a GECI generated from a fusion of the eGFP, calmodulin (CaM), and a short peptide from myosin light chain kinase (M13). To generate the Tet-inducible GECI plasmid, we amplified the GCaMP6s sequence from pGP-CMV-GCaMP6s (40753; Addgene, Watertown, MA, USA) by adding a gateway adapter sequence at both 5′ and 3′ end. The amplified GCaMP6s was cloned into the Piggybac (PB), PB-TAC-ERP2 vector (80478; Addgene, Watertown, MA), using the Gateway™ LR Clonase™ II enzyme mix (Thermo Fisher, Waltham, MA, USA). The hiPSCs were transfected with the PB-TAC-ERP2-GCaMP6s plasmid (Donor plasmid; Addgene, Watertown, MA, USA) and the piggybac transposase vector (pCAGPBase; Addgene, Watertown, MA, USA) applying the magnetofection method (Magnetofectamine O2, OZ Biosciences, Marseille, France) to generate the GECI hiPSC line. The transposase enzyme facilitates the integration of the DNA elements in ITR sites present in the genome at random location The selection was performed with puromycin at a concentration of 2 µg/mL. After generation of the GECI-eGFP+-hiPSCs, cells were differentiated into GECI-eGFP+-CMs. Induction of GECI in CMs was induced by adding Doxycycline (500 nM) for 6 h (attL-recombination site left, attR-recombination site right, attB-attachment site bacteria).
Figure 2
Figure 2
Generation of α-actinin (ACTN2)-copepod green fluorescent protein (copGFP+)-human-induced pluripotent stem cell line (IMR90) by the CRISPR-Cas9 and the homology-directed recombination (HDR) approach. The overall CRISPR-Cas9-based strategy to generate the transgenic ACTN2-copGFP-IMR90 line was by copGFP knock-in at chromosome. First, gRNA targeting of the ACTN2 3′ end was designed to delete the stop codon in exon 21 of the native ACTN2, located into chromosome 1. The donor plasmid with ~600 bp 5′ and 3′ homology arms was designed and ordered from ALSTEM, LLC San Francisco, US. The homology arms were designed in such a way that upon HDR the stop codon from the native ACTN2 gene could be deleted, whereas the reading frame remained as it was. These homology arms were then cloned into the pUC57 plasmid backbone along with the copGFP and LoxP flanked puromycin resistance gene with the EF1α promoter. To avoid any interference from copGFP with the ACTN2 functions and vice-versa, a glycine-rich linker (GGGGSGGGGSGGGGS) sequence was added. The linker provided a flexible connection between the two proteins, while avoiding interference in their functional properties (cloning sequences are shown in the Table S1, Supplemental Information). The donor plasmid along with ACTN2-gRNA plasmid was transfected into IMR90 cells using the magnetofectamine method (OZ Biosciences, Marseille, France) and positive clones were selected using puromycin (2 µg/mL). Positive clones were expanded and knock-in of copGFP was confirmed by differentiating the cells into cardiomyocytes by following our standard differentiation protocol.
Figure 3
Figure 3
Effects of various agonists on [Ca2+]i fluctuations during contraction of cardiomyocytes (CMs). (A), Induction of genetically encoded calcium indicator (GECI)-enhanced green fluorescent protein (eGFP+)-CMs was induced by adding Doxycycline (500 nM) for 6 h. Live-imaging of [Ca2+]i fluctuations during contraction of GECI-eGFP+-control-CMs in the presence and absence of the distinct agents were captured with the Olympus FluoView1000 confocal system (50 fps; 10 to 30 s; 60× objective; Em/Exit: 488:510 nm; see also Videos S1, S2 and S4). The video recordings of the [Ca2+]i transient fluctuations were analyzed with the software Video Analyzer 1.9, allowing determination of all the experimental parameters between the time points 1 to 3 in the figure (for the control CMs; c-CMs). Parameters were used to calculate the Time-to-peak (TTP), (∆F/∆T)max and (time to 90% of peak)T90 in the presence and absence of different drugs. (B), Diagrams show the effects of the different agonists and antagonists on (∆F/∆T)max and T90 values of the Ca2+ transient. Values are expressed as a percent of the c-CM values, which were set to 100% (mean ± SEM, n = 6, * p < 0.05; 6 independent experiments).
Figure 4
Figure 4
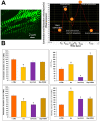
Live-imaging of contraction and relaxation velocity activity of α-actinin (ACTN2)-copepod green fluorescent protein (copGFP+)-cardiomyocytes (CMs). Live-imaging of the contractile and relaxation velocities of the ACTN2-copGFP+-CMs in the presence and absence of the distinct agents. Video recordings were captured with the Olympus FluoView1000 confocal system (50 fps; 10 to 30 s; 60× oil objective). (A), ACTN2 is enriched in Z-discs of the sarcomeres of ACTN2-copGFP+-CMs (see also Videos S5–S7). The video recordings of the fluctuations of the contractile and relaxation velocities were analyzed with the software Video Analyzer 1.9, allowing determination of all the experimental parameters between the time points 1 to 5 in the figure (for control CMs; c-CMs). Parameters were used for the calculation of time-to-peak (TTP), slope (∆F/∆T)max, T90, and the contraction and relaxation times for c-CMs. (B), Diagrams show the effects of the different agonists and antagonists on (∆F/∆T)max, on the contraction/relaxation times and on the beating frequency in the presence and absence of the different drugs. Values are expressed as a percentage of the c-CM values, which were set to 100% (mean ± SEM, n = 6, * p < 0.05; 6 independent experiments).

References

    1. Lazzarini V., Mentz R.J., Fiuzat M., Metra M., O’Connor C.M. Heart failure in elderly patients: Distinctive features and unresolved issues. Eur. J. Heart Fail. 2013;15:717–723. doi: 10.1093/eurjhf/hft028. - DOI - PMC - PubMed
    1. Lein E.S., Hawrylycz M.J., Ao N., Ayres M., Bensinger A., Bernard A., Boe A.F., Boguski M.S., Brockway K.S., Byrnes E.J., et al. Genome-Wide atlas of gene expression in the adult mouse brain. Nature. 2007;445:168–176. doi: 10.1038/nature05453. - DOI - PubMed
    1. Harvey P.A., Leinwand L.A. The cell biology of disease: Cellular mechanisms of cardiomyopathy. J. Cell Biol. 2011;194:355–365. doi: 10.1083/jcb.201101100. - DOI - PMC - PubMed
    1. Lyon R.C., Zanella F., Omens J.H., Sheikh F. Mechanotransduction in cardiac hypertrophy and failure. Circ. Res. 2015;116:1462–1476. doi: 10.1161/CIRCRESAHA.116.304937. - DOI - PMC - PubMed
    1. Hwang P.M., Sykes B.D. Targeting the sarcomere to correct muscle function. Nat. Rev. Drug Discov. 2015;14:313–328. doi: 10.1038/nrd4554. - DOI - PubMed

Publication types

LinkOut - more resources