. 2022 Mar 24;11(4):397.
doi: 10.3390/pathogens11040397.

Mucosal Antibody Response to SARS-CoV-2 in Paediatric and Adult Patients: A Longitudinal Study

Affiliations

Mucosal Antibody Response to SARS-CoV-2 in Paediatric and Adult Patients: A Longitudinal Study

Renee W Y Chan et al. Pathogens. .

Abstract

Background: SARS-CoV-2 enters the body through inhalation or self-inoculation to mucosal surfaces. The kinetics of the ocular and nasal mucosal-specific-immunoglobulin A(IgA) responses remain under-studied.

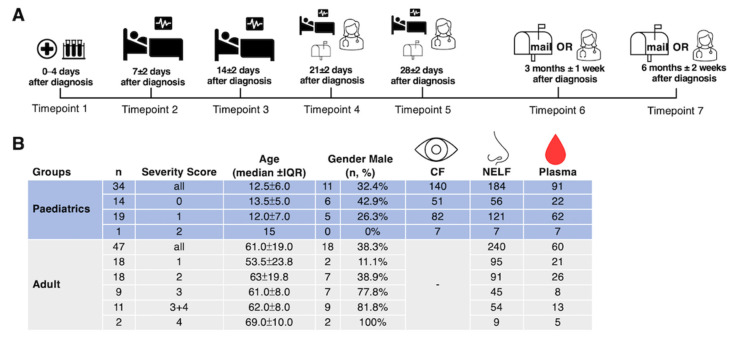
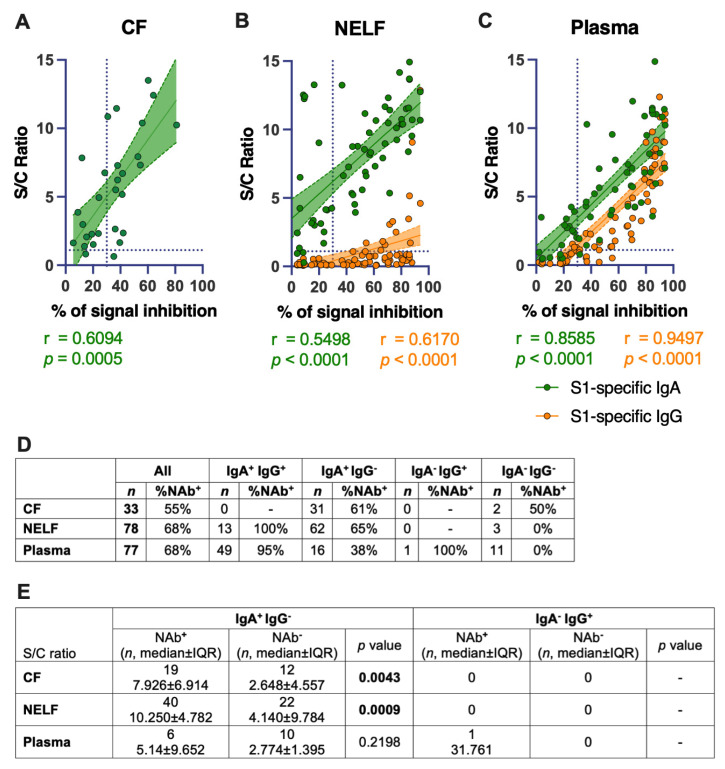
Methods: Conjunctival fluid (CF, n = 140) and nasal epithelial lining fluid (NELF, n = 424) obtained by paper strips and plasma (n = 153) were collected longitudinally from SARS-CoV-2 paediatric (n = 34) and adult (n = 47) patients. The SARS-CoV-2 spike protein 1(S1)-specific mucosal antibody levels in COVID-19 patients, from hospital admission to six months post-diagnosis, were assessed.

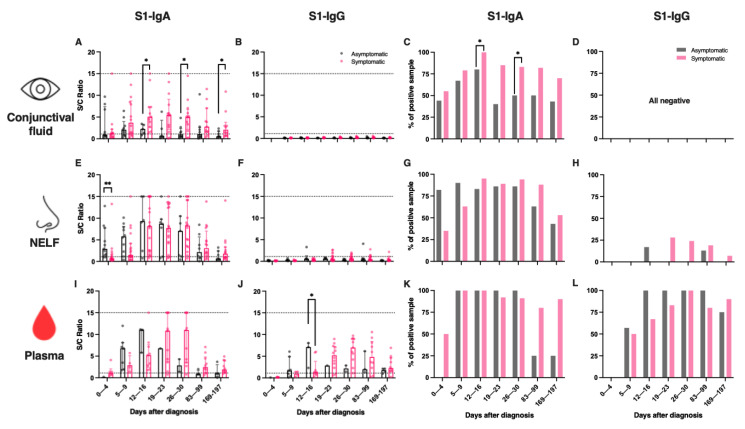
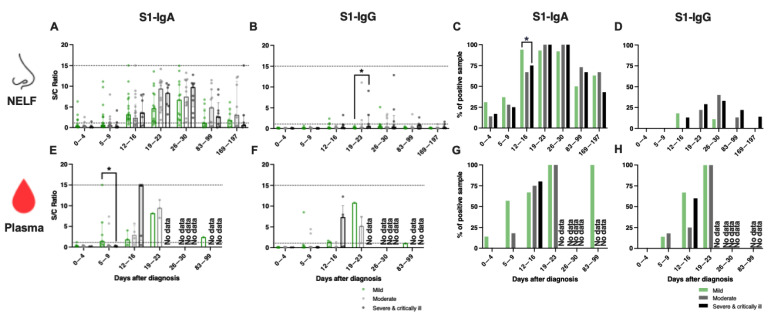
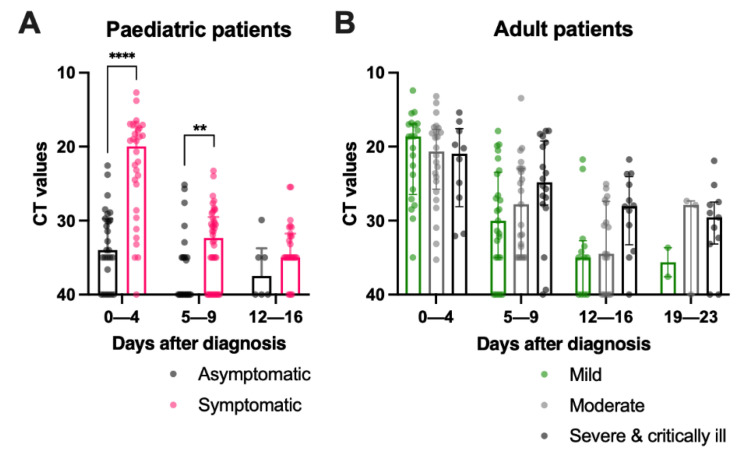
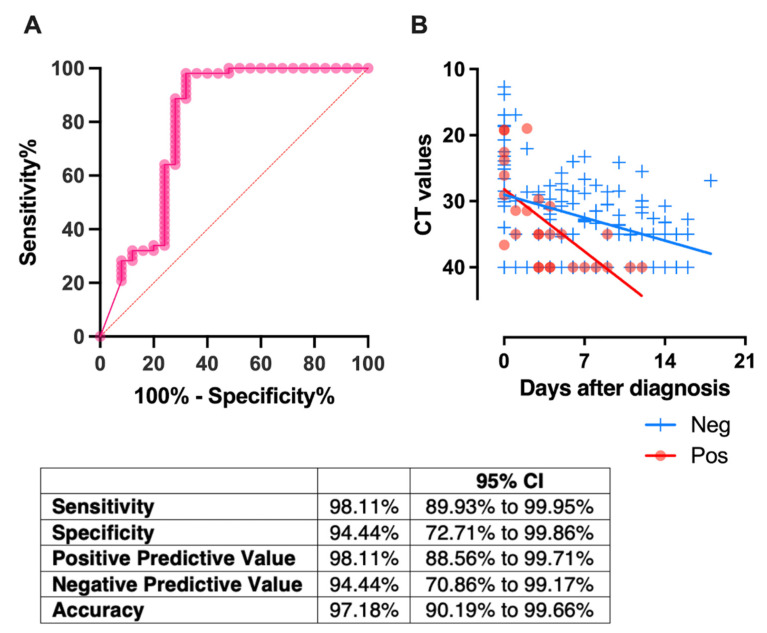
Results: The mucosal antibody was IgA-predominant. In the NELF of asymptomatic paediatric patients, S1-specific IgA was induced as early as the first four days post-diagnosis. Their plasma S1-specific IgG levels were higher than in symptomatic patients in the second week after diagnosis. The IgA and IgG levels correlated positively with the surrogate neutralization readout. The detectable NELF "receptor-blocking" S1-specific IgA in the first week after diagnosis correlated with a rapid decline in viral load.

Conclusions: Early and intense nasal S1-specific IgA levels link to a rapid decrease in viral load. Our results provide insights into the role of mucosal immunity in SARS-CoV-2 exposure and protection. There may be a role of NELF IgA in the screening and diagnosis of SARS-CoV-2 infection.

Keywords: SARS-CoV-2; mucosal antibody; paediatric; specific IgA; specific IgG.


Conflict of interest statement

The authors declare no conflict of interest.

Figures

Figure 1
Figure 1
Study design and demographics. (A) A longitudinal sample collection, from the day of diagnosis (disease onset or the first day of a SARS-CoV-2 PCR positive result, whichever was earlier) to six months post-diagnosis, was conducted by healthcare workers during hospitalization and follow-up consultations for paediatric patients. Adult patients performed the self-collection of NELF samples after being discharged and mailed the samples to the laboratory. (B) The number of asymptomatic and symptomatic paediatric and adult subjects, their severity score (0: asymptomatic; 1: mild; 2: moderate; 3: severe; 4: critically ill), age, gender, and the number of CF, NELF and plasma samples collected are shown.
Figure 2
Figure 2
SARS-CoV-2 S1-specific antibody levels and the percentage of positive samples in the (AD) conjunctival fluid, (EH) nasal epithelial lining fluid (NELF), and (IL) plasma of in asymptomatic and symptomatic paediatric patients. Grey and pink symbols indicate data from asymptomatic and symptomatic patients, respectively. Antibody-level data points above the dotted line (sample/calibrator (S/C) ratio ≥ 1.1) are considered as positive, while the dotted lines at y = 15 indicate the upper detection limit of the assay. The median and interquartile ranges are plotted, with dots representing individual values. The percentages denote the IgA and IgG positivity at each time point. The levels of S1-specific Ig were compared between asymptomatic and symptomatic patients via the Mann–Whitney test, while the percentage of positive samples was established by Fisher’s exact test at each time point. The asterisks indicate the statistical differences found; *: p < 0.05 and **: p < 0.01. “No data” indicates that the corresponding time point had no samples available.
Figure 3
Figure 3
SARS-CoV-2 S1-specific antibody levels in the (AD) nasal epithelial lining fluid (NELF) and (EH) plasma in adult COVID-19 patients of different disease severity groups, from acute infection to the convalescent phase. Green, grey and black symbols indicate data of mild, moderate, and severe and critically ill patients, respectively. Antibody-level data points above the dotted line (sample/calibrator (S/C) ratio ≥ 1.1) are considered as positive, while the dotted lines at y = 15 indicate the upper detection limit of the assay. Median and interquartile ranges are plotted, with dots representing individual values. The percentages denote IgA- and IgG-positivity at each time point. The levels of S1-specific Ig were compared among disease severity groups with the Kruskal–Wallis test, followed by Dunn’s multiple comparisons test, with the percentage of positive samples by Fisher’s exact test at each time point. The asterisks indicate the statistical differences found, *: p < 0.05. “No data” labels the corresponding time point as having no samples available.
Figure 4
Figure 4
Comparison of SARS-CoV-2 viral load in (A) paediatric and (B) adult COVID-19 paediatric patients of different disease severities during hospitalization. The cycle threshold (CT) values of the SARS-CoV-2 viral gene in (A) asymptomatic and symptomatic paediatric patients were compared with the Mann–Whitney test and among (B) mild, moderate, and severe and critically ill adult patients by the Kruskal–Wallis test, followed by Dunn’s multiple comparisons test at each time point. Median and interquartile ranges are plotted with dots representing individual values. The asterisks indicate the statistical differences found, **: p < 0.01 and ****: p < 0.0001.
Figure 5
Figure 5
Correlation of SARS-CoV-2 S1-specific Igs to the percentage of signal inhibition in the surrogate ACE-2-based neutralization readout. (A) The correlation coefficients of the conjunctival fluid, (B) NELF, and (C) plasma of COVID-19 patients are superimposed on the panel, with trend lines estimated with the use of simple linear regression. Plots show the S/C ratio of the IgA (green) and IgG (orange), plotted against the percentage of inhibition of the SARS-CoV-2 spike-ACE-2 binding signal, in which an inhibition of ≥ 30% is regarded as the threshold for a positive sample, indicated by the vertical dotted line. Green and orange dotted lines represent significant linear regression fits, with 95% confidence intervals (a shaded region with the corresponding colors). (D) The table shows the number of each sample type included (n) in the surrogate neutralization test and the overall percentage of the sample with a neutralization effect. The number of samples with specific immunological status (e.g., IgA+IgG+) and the corresponding percentage of that immunological status with a neutralizing effect (i.e., ≥30% inhibition) are shown. (E) Comparison of the IgA levels between neutralizing (NAb+) and non-neutralizing (Nab) samples with the immunological status of IgA+IgG was performed with a Mann–Whitney test.
Figure 6
Figure 6
(A) Receiver-operating characteristic (ROC) curves, constructed using 78 NELF samples, with both IgA and NAb levels measured. The area under the curve (AUC) was 0.80 with p < 0.001. Using the ROC curve, the threshold for NELF IgA was defined as > 4.386 by the Youden index calculation. Using this cutoff value, the sensitivity and specificity were 98.11% and 94.44%, respectively, with an accuracy of 97.18%. (B) All the available CT values of the paediatric patients who showed NELF IgA levels above formula image and below formula image the thresholds level are plotted against time. For this panel data, a fixed-effect regression model was applied to compare the changes of the CT values across time between these 2 groups. A statistically significant difference was found in the decline rate of the viral load at p = 0.002.

References

    1. Sungnak W., Huang N., Becavin C., Berg M., Queen R., Litvinukova M., Talavera-Lopez C., Maatz H., Reichart D., Sampaziotis F., et al. SARS-CoV-2 entry factors are highly expressed in nasal epithelial cells together with innate immune genes. Nat. Med. 2020;26:681–687. doi: 10.1038/s41591-020-0868-6. - DOI - PMC - PubMed
    1. Walls A.C., Park Y.-J., Tortorici M.A., Wall A., McGuire A.T., Veesler D. Structure, Function, and Antigenicity of the SARS-CoV-2 Spike Glycoprotein. Cell. 2020;181:281–292.e6. doi: 10.1016/j.cell.2020.02.058. - DOI - PMC - PubMed
    1. Baig A.M., Ahmad S., Khaleeq A., Rafique H., Rajput S., Angez M., Hameed A., Nawaz T., Katyara P. Ocular COVID-19: Eyes as a Reservoir to Conceal and Spread SARSCoV-2. Infect. Disord. Drug Targets. 2021;21:480–483. doi: 10.2174/1871526520999200729182242. - DOI - PubMed
    1. Ma R., Gan L., Jiang S., Ding P., Chen D., Wu J., Qian J. High expression of SARS-CoV-2 entry factors in human conjunctival goblet cells. Exp. Eye Res. 2021;205:108501. doi: 10.1016/j.exer.2021.108501. - DOI - PMC - PubMed
    1. Cervia C., Nilsson J., Zurbuchen Y., Valaperti A., Schreiner J., Wolfensberger A., Raeber M.E., Adamo S., Weigang S., Emmenegger M., et al. Systemic and mucosal antibody responses specific to SARS-CoV-2 during mild versus severe COVID-19. J. Allergy Clin. Immunol. 2021;147:545–557.e9. doi: 10.1016/j.jaci.2020.10.040. - DOI - PMC - PubMed