. 2022 Apr 10;13(4):668.
doi: 10.3390/genes13040668.

Integrated Analysis of the ceRNA Network and M-7474 Function in Testosterone-Mediated Fat Deposition in Pigs

Affiliations

Integrated Analysis of the ceRNA Network and M-7474 Function in Testosterone-Mediated Fat Deposition in Pigs

Ximing Liu et al. Genes (Basel). .

Abstract

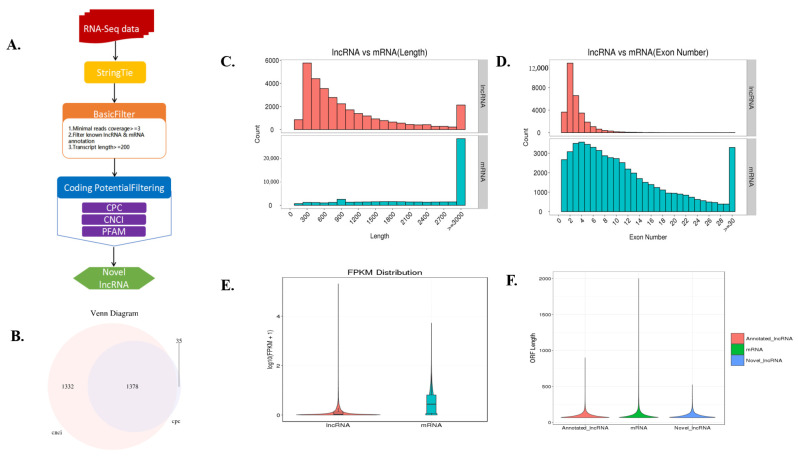
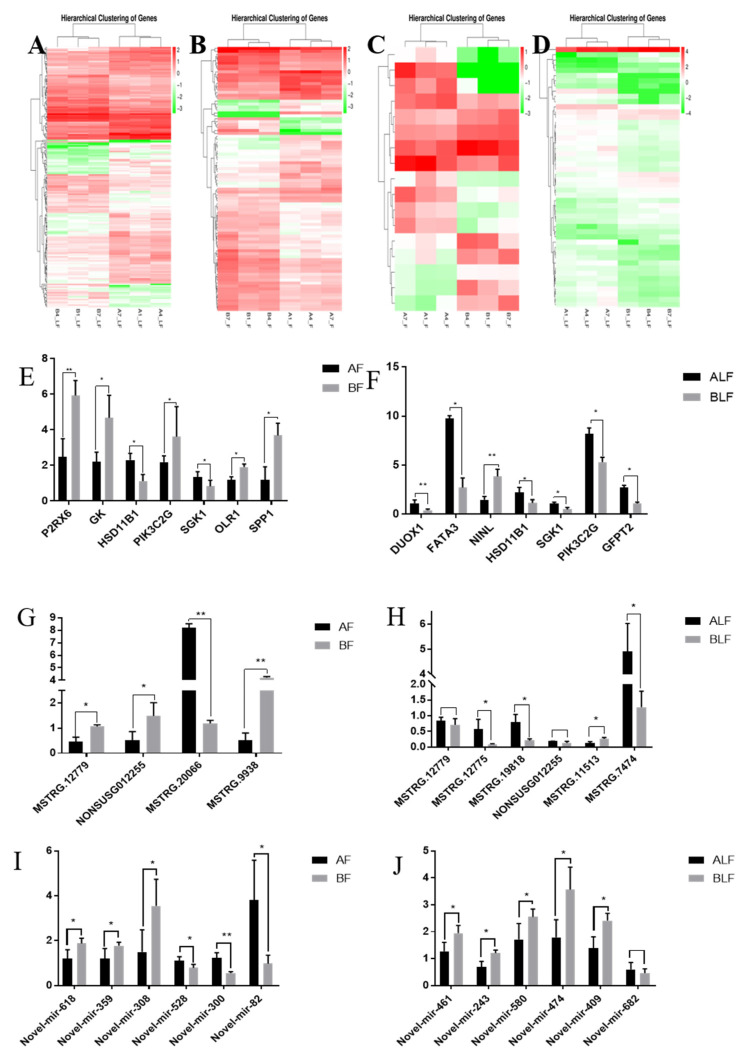
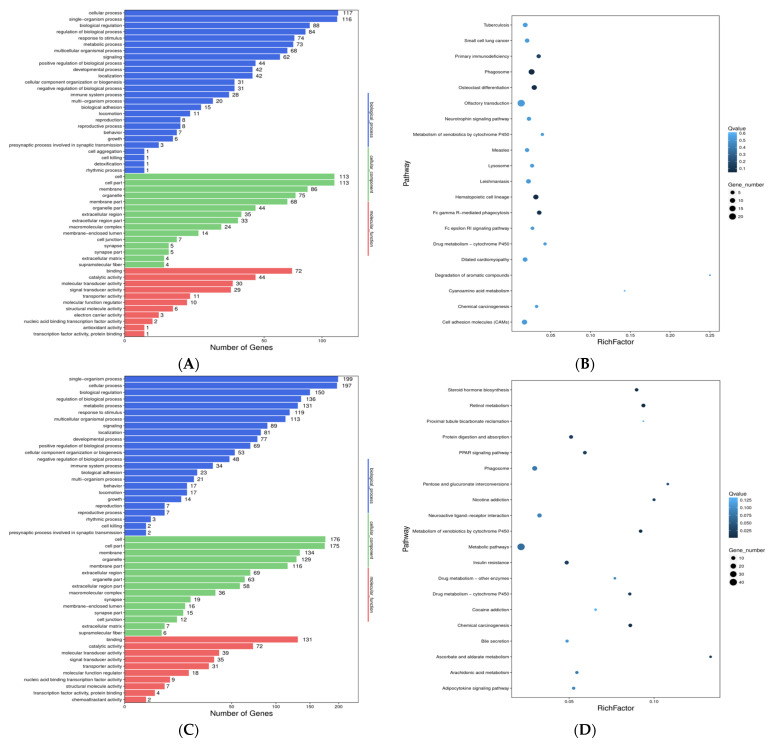
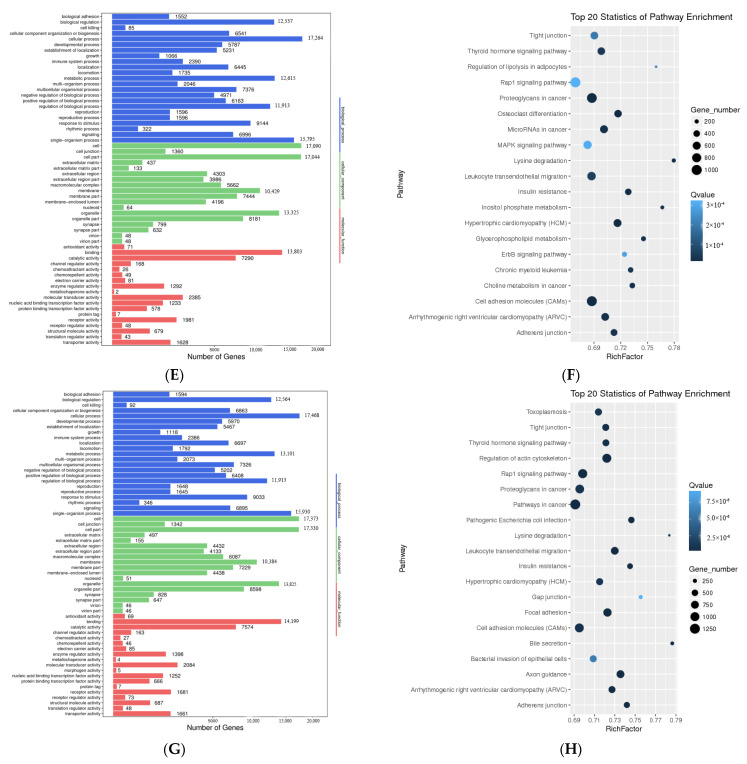
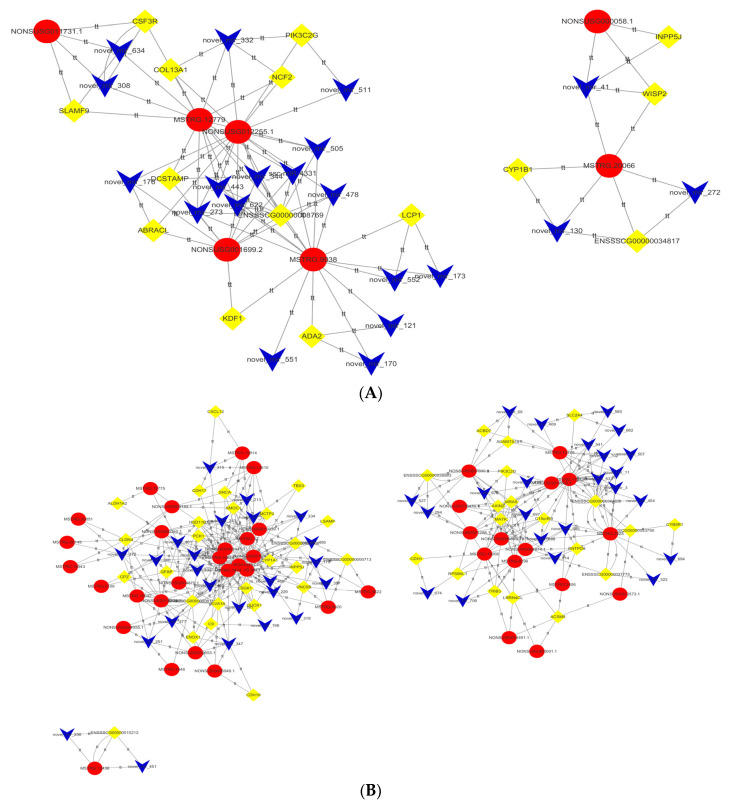
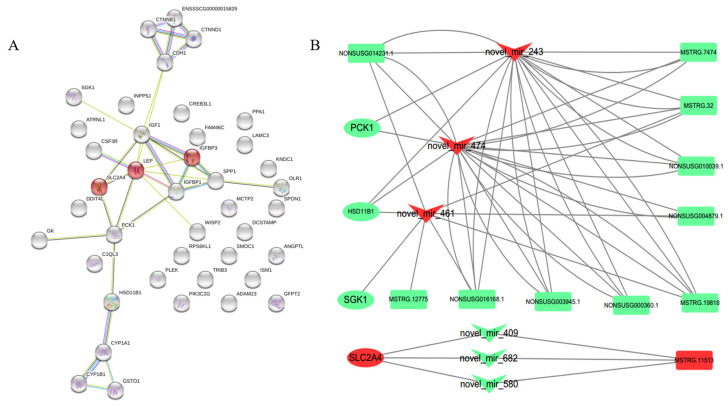
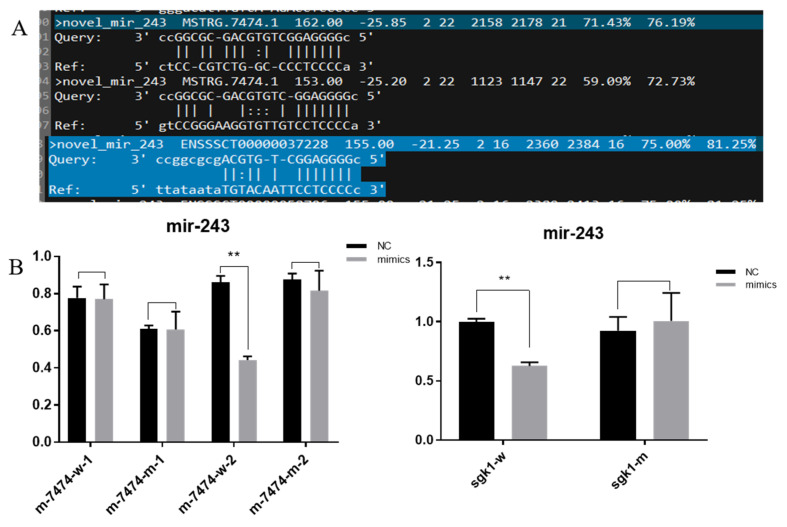
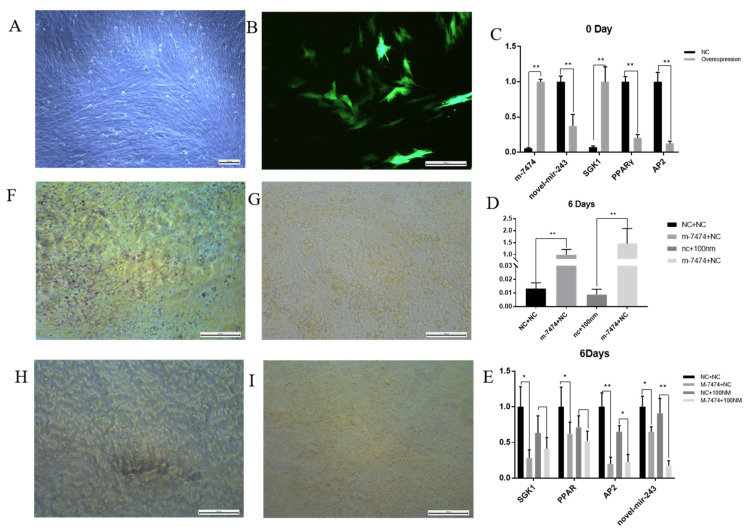
Castration can significantly enhance fat deposition in pigs, and the molecular mechanism of fat deposition caused by castration and its influence on fat deposition in different parts of pigs remain unclear. RNA-seq was performed on adipose tissue from different parts of castrated and intact Yorkshire pigs. Different ceRNA networks were constructed for different fat parts. GO and KEGG pathway annotations suggested that testosterone elevates cell migration and affects differentiation and apoptosis in back fat, while it predisposes animals to glycolipid metabolism disorders and increases the expression of inflammatory cytokines in abdominal fat. The interaction between M-7474, novel_miR_243 and SGK1 was verified by dual fluorescence experiments. This ceRNA relationship has also been demonstrated in porcine preadipocytes. Overexpression of M-7474 significantly inhibited the differentiation of preadipocytes compared to the control group. When 100 nM testosterone was added during preadipocyte differentiation, the expression of M-7474 was increased, and preadipocyte differentiation was significantly inhibited. Testosterone can affect preadipocyte differentiation by upregulating the expression of M-7474, sponging novel-miR-243, and regulating the expression of genes such as SGK1. At the same time, HSD11B1 and SLC2A4 may also be regulated by the corresponding lncRNA and miRNA, which ultimately affects glucose uptake by adipocytes and leads to obesity.

Keywords: castration; ceRNA; fat deposition; lncRNA; testosterone.


Conflict of interest statement

The authors declare no conflict of interest.

Figures

Figure 1
Figure 1
Identification of long noncoding RNAs (lncRNAs) and their comparison with mRNAs at the genomic structure and expression levels. (A) Workflow for lncRNA identification. (B) Candidate lncRNAs were identified by using two applications: CNCI (coding-noncoding-index) and CPC (coding potential calculator), which detect and remove putative protein-coding transcripts. (C) Distribution of lengths of lncRNAs and mRNAs. (D) Distribution of the number of exons of lncRNAs and mRNAs. (E) Expression levels of lncRNAs and mRNAs, calculated as log10(FPKM + 1). FRKM: Fragments per kilobase of exon per million fragments mapped. (F) The ORF sequence is converted to the length of the protein sequence.
Figure 2
Figure 2
Hierarchical clustering analysis was performed based on the FPKM values of differentially expressed genes under different experimental conditions. (A). Cluster analysis of gene levels in castrated and intact pig backfat tissues. (B). Cluster analysis of gene levels in castrated and intact pig abdominal tissues. (C). Cluster analysis of lncRNA levels in castrated and intact pig backfat tissues. (D). Cluster analysis of lncRNA levels in castrated and intact pig abdominal tissues. Quantitative PCR validation. Differentially expressed genes (E,F), lncRNAs (G,H) and miRNAs (I,J) were confirmed by quantitative PCR. The results are shown as the means ± standard deviation of triplicate measurements. AF indicates intact backfat, BF indicates castrated backfat, ALF indicates intact abdominal fat, BLF indicates castrated abdominal fat. * indicates p < 0.05, ** indicates p < 0.01.
Figure 3
Figure 3
Crucial pathways were clustered from DE lncRNA trans-related genes. (A). Gene ontology (GO) function of differentially expressed lncRNA-related mRNAs was classified and analyzed according to trans effect analysis in castrated and intact pig backfat tissues. (B). KEGG enrichment analyzed according to trans effect analysis in castrated and intact pig backfat tissues. (C). Gene ontology (GO) function of differentially expressed known DEmiRNA target mRNAs in castrated and intact pig abdominal tissues. (D). KEGG enrichment analysis according to known DEmiRNA target mRNAs in castrated and intact pig abdominal tissues. Gene ontology (GO) function was classified, and KEGG enrichment was analyzed according to related mRNAs. (E). Gene ontology (GO) function of differentially expressed lncRNA-related mRNAs was classified and analyzed according to trans effect analysis inS castrated and intact pig abdominal tissues. (F). KEGG enrichment analyzed according to trans effect analysis in castrated and intact pig abdominal tissues. (G). Gene ontology (GO) function of differentially expressed known DEmiRNA target mRNAs in castrated and intact pig abdominal tissues. (H). KEGG enrichment analysis according to known DEmiRNA target mRNAs in castrated and intact pig abdominal tissues.
Figure 3
Figure 3
Crucial pathways were clustered from DE lncRNA trans-related genes. (A). Gene ontology (GO) function of differentially expressed lncRNA-related mRNAs was classified and analyzed according to trans effect analysis in castrated and intact pig backfat tissues. (B). KEGG enrichment analyzed according to trans effect analysis in castrated and intact pig backfat tissues. (C). Gene ontology (GO) function of differentially expressed known DEmiRNA target mRNAs in castrated and intact pig abdominal tissues. (D). KEGG enrichment analysis according to known DEmiRNA target mRNAs in castrated and intact pig abdominal tissues. Gene ontology (GO) function was classified, and KEGG enrichment was analyzed according to related mRNAs. (E). Gene ontology (GO) function of differentially expressed lncRNA-related mRNAs was classified and analyzed according to trans effect analysis inS castrated and intact pig abdominal tissues. (F). KEGG enrichment analyzed according to trans effect analysis in castrated and intact pig abdominal tissues. (G). Gene ontology (GO) function of differentially expressed known DEmiRNA target mRNAs in castrated and intact pig abdominal tissues. (H). KEGG enrichment analysis according to known DEmiRNA target mRNAs in castrated and intact pig abdominal tissues.
Figure 4
Figure 4
Construction of the ceRNA network. (A). The ceRNA network is composed of miRDElncRNAs, DEmiRNAs and DEmRNAs from castrated and intact pig back adipose tissue. (B). The ceRNA network is composed of miRDElncRNAs, DEmiRNAs and DEmRNAs from castrated and intact pig adipose tissue. Circle indicates DE lncRNAs, rhombus indicates DE mRNAs, V shape indicates DE miRNAs.
Figure 5
Figure 5
(A). Some of the differentially expressed genes were analyzed by protein interactions with STRING. (B). LncRNAs regulate the ceRNA network of related genes through miRNAs. Circle indicates DE mRNAs, rectangle indicates DE lncRNAs, V shape indicates DE miRNAs.
Figure 6
Figure 6
(A). MiRNA binding locations predicted by miRanda software. (B). Double fluorescence verification experiment. ** indicates p < 0.01, Nc is the control group, mimics refers to the overexpression of miR-243.
Figure 7
Figure 7
Preadipocyte differentiation experiment of the M-7474-overexpressing group. (A). Bright field image of preadipocytes overexpressing M-7474. (B). Fluorescent image of the anterior adipocytes after overexpression of M-7474. (CE). qPCR quantification of related genes. (F). Oil red O staining was performed 6 days after differentiation in the NC group without testosterone addition. (G). Oil red O staining was performed 6 days after differentiation in the overexpressed M-7474 group without testosterone addition (H). The NC group was differentiated with 100 nm testosterone for 6 days after oil red O staining (I). The overexpressed M-7474 group was differentiated with 100 nm testosterone for 6 days after oil red O staining. NC indicates control group, M-7474 indicates lncRNA overexpression group, Nc + 100 nM indicates NC group was added with 100 nm testosterone, M-7474 + NC indicates lncRNA overexpression group was added with 100 nm testosterone. * indicates p < 0.05, ** indicates p < 0.01.

Similar articles

Cited by

References

    1. Tsai E.C., Boyko E.J., Leonetti D.L., Fujimoto W.Y. Low serum testosterone level as a predictor of increased visceral fat in Japanese-American men. Int. J. Obes. Relat. Metab. Disord. 2000;24:485–491. doi: 10.1038/sj.ijo.0801183. - DOI - PubMed
    1. Bender J.M., See M.T., Hanson D.J., Lawrence T.E., Cassady J.P. Correlated responses in growth, carcass, and meat quality traits to divergent selection for testosterone production in pigs. J. Anim. Sci. 2006;84:1331–1337. doi: 10.2527/2006.8461331x. - DOI - PubMed
    1. Takeda H., Chodak G., Mutchnik S., Nakamoto T., Chang C. Immunohistochemical localization of androgen receptors with mono- and polyclonal antibodies to androgen receptor. J. Endocrinol. 1990;126:17–25. doi: 10.1677/joe.0.1260017. - DOI - PubMed
    1. Robison O.W., Johnson B., Lubritz D. Genetic parameters for testosterone production in boars. J. Anim. Sci. 1991;69:3220–3224. - PubMed
    1. Yeh S., Tsai M.Y., Xu Q., Mu X.M., Lardy H., Huang K.E., Lin H., Yeh S.D., Altuwaijri S., Zhou X., et al. Generation and characterization of androgen receptor knockout (ARKO) mice: An in vivo model for the study of androgen functions in selective tissues. Proc. Natl. Acad. Sci. USA. 2002;99:13498–13503. doi: 10.1073/pnas.212474399. - DOI - PMC - PubMed

Publication types

LinkOut - more resources