

Comparative Proteomic Analysis of Two Contrasting Maize Hybrids' Responses to Low Nitrogen Stress at the Twelve Leaf Stage and Function Verification of ZmTGA Gene
- PMID: 35456476
- PMCID: PMC9030517
- DOI: 10.3390/genes13040670
Comparative Proteomic Analysis of Two Contrasting Maize Hybrids' Responses to Low Nitrogen Stress at the Twelve Leaf Stage and Function Verification of ZmTGA Gene
Abstract
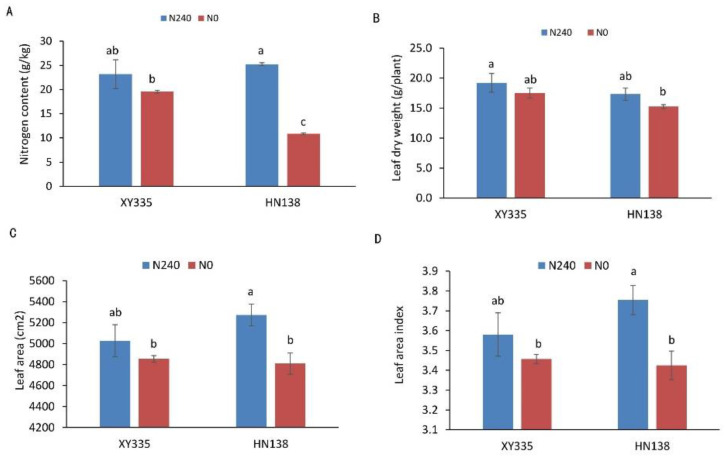
Nitrogen is one of the essential nutrients for plant growth and development. However, large amounts of nitrogen fertilizer not only increase the production costs, but also lead to serious environmental problems. Therefore, it is particularly important to reduce the application of nitrogen fertilizer and develop maize varieties with low nitrogen tolerance. The aim of this study was to determine the phenotypic and proteomic alterations of maize affected by nitrogen deficiency and to elucidate the molecular and physiological mechanisms underpinning maize tolerance to low nitrogen. Two maize hybrids with contrasting low nitrogen tolerance were used as the experimental materials. Maize plants were grown under different nitrogen application levels (N0 and N240) and proteomic analysis performed to analyze leaf differentially abundant proteins (DAPs) under different nitrogen conditions. The results showed that under the nitrogen deficiency condition, the nitrogen content, leaf dry weight, leaf area, and leaf area index of XY335 decreased by 15.58%, 8.83%, 3.44%, and 3.44%, respectively. However, in the variety HN138, the same parameters decreased by 56.94%, 11.97%, 8.79%, and 8.79%, respectively. Through proteomic analysis, we found that the low nitrogen tolerance variety responded to low nitrogen stress through lignin biosynthesis, ubiquitin-mediated proteolysis, and stress defense proteins. Transmembrane transporters were differentially expressed in both hybrids after low nitrogen treatment, suggesting that this was a common response to low nitrogen stress. Using bioinformatics analysis, we selected the key candidate gene (ZmTGA) that was assumed to respond to low nitrogen stress, and its function was characterized by maize mutants. The results showed that when compared with normal nitrogen treatment, the root length of the mutants under low nitrogen treatment increased by 10.1%, while that of the wild-type increased by 14.8%; the root surface area of the wild type under low nitrogen treatment increased by 9.6%, while that of the mutants decreased by 5.2%; the root surface area of the wild type was higher than that of the mutant at both nitrogen levels; and the activities of glutathione and guaiacol peroxidase enzymes in the mutant were lower than those in the wild-type under low nitrogen treatment. In summary, the mutant was less adaptable to a low nitrogen environment than the wild type. Our results provide maize genetic resources and a new direction for a further understanding of maize response to low nitrogen stress.
Keywords: DAPs; Zea mays L.; low nitrogen tolerance; morphological characteristics.
Conflict of interest statement
The authors declare no conflict of interest.
Figures


Similar articles
-
Integrated Transcriptomic and Proteomic Analyses of Low-Nitrogen-Stress Tolerance and Function Analysis of ZmGST42 Gene in Maize.Antioxidants (Basel). 2023 Oct 5;12(10):1831. doi: 10.3390/antiox12101831. Antioxidants (Basel). 2023. PMID: 37891910 Free PMC article.
-
Comparative transcriptomic and physiological analyses of contrasting hybrid cultivars ND476 and ZX978 identify important differentially expressed genes and pathways regulating drought stress tolerance in maize.Genes Genomics. 2020 Aug;42(8):937-955. doi: 10.1007/s13258-020-00962-4. Epub 2020 Jul 4. Genes Genomics. 2020. PMID: 32623576
-
Comparative physiological and transcriptome analysis of leaf nitrogen fluxes in stay-green maize during the vegetative stage.Plant Physiol Biochem. 2023 Nov;204:108147. doi: 10.1016/j.plaphy.2023.108147. Epub 2023 Oct 29. Plant Physiol Biochem. 2023. PMID: 37922646
-
Effects of nitrogen deficiency on photosynthetic traits of maize hybrids released in different years.Ann Bot. 2005 Oct;96(5):925-30. doi: 10.1093/aob/mci244. Epub 2005 Aug 15. Ann Bot. 2005. PMID: 16103036 Free PMC article.
-
Maize Plant Resilience to N Stress and Post-silking N Capacity Changes over Time: A Review.Front Plant Sci. 2016 Feb 9;7:53. doi: 10.3389/fpls.2016.00053. eCollection 2016. Front Plant Sci. 2016. PMID: 26904038 Free PMC article. Review.
Cited by
-
Comparative physiological, metabolomic, and transcriptomic analyses reveal mechanisms of apple dwarfing rootstock root morphogenesis under nitrogen and/or phosphorus deficient conditions.Front Plant Sci. 2023 Jun 19;14:1120777. doi: 10.3389/fpls.2023.1120777. eCollection 2023. Front Plant Sci. 2023. PMID: 37404544 Free PMC article.
-
Integrated Transcriptomic and Proteomic Analyses of Low-Nitrogen-Stress Tolerance and Function Analysis of ZmGST42 Gene in Maize.Antioxidants (Basel). 2023 Oct 5;12(10):1831. doi: 10.3390/antiox12101831. Antioxidants (Basel). 2023. PMID: 37891910 Free PMC article.
References
-
- Li Z.N., Xing J., Wang Y., Wen H.T., Wen H.T., Li L., Zhang X., Fan Y.-L., Zhao J. Maize ABP2 enhances tolerance to drought and salt stress in transgenic Arabidopsis. J. Integr. Agric. 2018;17:2379–2393. doi: 10.1016/S2095-3119(18)61947-1. - DOI
-
- Kosgey J.R., Moot D.J., Fletcher A.L., Mckenzie B.A. Dry matter accumulation and post-silking N economy of ′stay-green′ maize (Zea mays L.) hybrids. Eur. J. Agron. 2013;51:43–52. doi: 10.1016/j.eja.2013.07.001. - DOI
-
- Rens L.R., Zotarelli L., Cantliffe D.J., Stoffella P.J., Gergela D., Fourman D. Biomass Accumulation, Marketable Yield, and Quality of Atlantic Potato in Response to Nitrogen. Agron. J. 2015;107:931–942. doi: 10.2134/agronj14.0408. - DOI
-
- Pingle G. Managing critical plant growth stages. Farmer’s Wkly. 2017;2017:46–49.
Publication types
MeSH terms
Substances
LinkOut - more resources
Full Text Sources
Molecular Biology Databases
