. 2022 Apr 13;13(4):680.
doi: 10.3390/genes13040680.

Transcriptomic Analysis of Canine Osteosarcoma from a Precision Medicine Perspective Reveals Limitations of Differential Gene Expression Studies

Affiliations

Transcriptomic Analysis of Canine Osteosarcoma from a Precision Medicine Perspective Reveals Limitations of Differential Gene Expression Studies

Rebecca L Nance et al. Genes (Basel). .

Abstract

Despite significant advances in cancer diagnosis and treatment, osteosarcoma (OSA), an aggressive primary bone tumor, has eluded attempts at improving patient survival for many decades. The difficulty in managing OSA lies in its extreme genetic complexity, drug resistance, and heterogeneity, making it improbable that a single-target treatment would be beneficial for the majority of affected individuals. Precision medicine seeks to fill this gap by addressing the intra- and inter-tumoral heterogeneity to improve patient outcome and survival. The characterization of differentially expressed genes (DEGs) unique to the tumor provides insight into the phenotype and can be useful for informing appropriate therapies as well as the development of novel treatments. Traditional DEG analysis combines patient data to derive statistically inferred genes that are dysregulated in the group; however, the results from this approach are not necessarily consistent across individual patients, thus contradicting the basis of precision medicine. Spontaneously occurring OSA in the dog shares remarkably similar clinical, histological, and molecular characteristics to the human disease and therefore serves as an excellent model. In this study, we use transcriptomic sequencing of RNA isolated from primary OSA tumor and patient-matched normal bone from seven dogs prior to chemotherapy to identify DEGs in the group. We then evaluate the universality of these changes in transcript levels across patients to identify DEGs at the individual level. These results can be useful for reframing our perspective of transcriptomic analysis from a precision medicine perspective by identifying variations in DEGs among individuals.

Keywords: cancer; canine; osteosarcoma; sequencing; transcriptome.


Conflict of interest statement

The authors declare no conflict of interest.

Figures

Figure 1
Figure 1
Overview of bioinformatic pipeline used to process and analyze data. RNA sequence data were subjected to modest trimming with Trimmomatic and quality analysis with FASTQC prior to mapping to the reference canine genome with HiSat2, counting reads with Stringtie, and DEG statistics with DEseq2 to generate significant DEGs (FDR < 0.05, FC > 2, ≤2) which were carried forward in pathway and individual analyses. Using the significant DEGs from the group analysis, fold-change values were generated for each patient to produce the individual-level data. Bioinformatic tools and packages utilized are indicated.
Figure 2
Figure 2
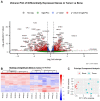
Analysis of differential gene expression in tumor vs normal group data reveals over 3000 significant DEGs. Volcano plot shows many genes are highly differentially expressed between tumor vs. normal (A). Genes indicated in red are significant in terms of both adjusted p-value (<0.05) and fold-change (>2 and ≤2). The sign of fold-change (positive or negative) was retained and is reported in terms of tumor compared to bone. Heatmap of the significant genes (FDR < 0.05) shows that these DEGs easily differentiate tumor from normal tissue (B). Each row represents a gene and upregulation is indicated in red, while downregulation is shown in blue. Patient and sample ID is indicated underneath the corresponding column. PCA plot shows grouping of normal bone samples (red circles) distinct from tumor samples (blue circles) as expected (C). The dispersion and variability of the tumor samples is thought to be related to intra- and inter-tumoral heterogeneity.
Figure 3
Figure 3
Pathway analysis of the upregulated DEGs using hallmark pathways (A) and gene ontology (GO) enrichment terms (B).
Figure 4
Figure 4
Plots of the normalized counts of the top up- and down-regulated genes in the classical group analysis show some variation among individual patients. The number one gene when ordered by log2 fold-change shows variation among individual patients (A,C). The top gene when ordered by smallest adjusted p-value shows less variation in terms of direction of fold-change, but some variation between individuals is still evident (B,D).
Figure 5
Figure 5
Plots of the top upregulated gene for each dog based on individual-level analysis reveal further variation among patients. The normalized counts of the top upregulated gene in each patient is shown. The top upregulated gene for patient A was ENSCAFG00000041995 (A). The top upregulated gene for patient B was LOC403585 (B). Patients C and G shared the same top upregulated gene, TFPI2 (C). The top upregulated gene for patient D was COL11A1 (D). The top upregulated gene for patient E was SFRP2 (E). The top upregulated gene for patient F was ENSCAFG00000028460 (F).
Figure 6
Figure 6
The top downregulated gene for each individual dog is shared among some patients. The normalized counts of the top downregulated gene in each patient are shown. The top downregulated gene in patient A was CYTL1 (A). Patients B, E, and G share the same top downregulated gene, ENSCAFG00000034058 (B). The top downregulated gene in patient C was MYOC (C). Patients D and F share the same top downregulated gene, MEPE (D).

Similar articles

Cited by

References

    1. Geller D.S., Gorlick R. Osteosarcoma: A Review of Diagnosis, Management, and Treatment Strategies. Clin. Adv. Hematol. Oncol. 2010;8:705–718. - PubMed
    1. Luetke A., Meyers P.A., Lewis I., Juergens H. Osteosarcoma Treatment—Where Do We Stand? A State of the Art Review. Cancer Treat. Rev. 2014;40:523–532. doi: 10.1016/j.ctrv.2013.11.006. - DOI - PubMed
    1. Longhi A., Errani C., De Paolis M., Mercuri M., Bacci G. Primary Bone Osteosarcoma in the Pediatric Age: State of the Art. Cancer Treat. Rev. 2006;32:423–436. doi: 10.1016/j.ctrv.2006.05.005. - DOI - PubMed
    1. Gorlick R., Khanna C. Osteosarcoma. J. Bone Min. Res. 2010;25:683–691. doi: 10.1002/jbmr.77. - DOI - PubMed
    1. Mirabello L., Troisi R.J., Savage S.A. Osteosarcoma Incidence and Survival Rates from 1973 to 2004: Data from the Surveillance, Epidemiology, and End Results Program. Cancer. 2009;115:1531–1543. doi: 10.1002/cncr.24121. - DOI - PMC - PubMed

Publication types