. 2022 Apr 15;10(4):821.
doi: 10.3390/microorganisms10040821.

Diffusional Interactions among Marine Phytoplankton and Bacterioplankton: Modelling H2O2 as a Case Study

Affiliations

Diffusional Interactions among Marine Phytoplankton and Bacterioplankton: Modelling H2O2 as a Case Study

Naaman M Omar et al. Microorganisms. .

Abstract

Marine phytoplankton vary widely in size across taxa, and in cell suspension densities across habitats and growth states. Cell suspension density and total biovolume determine the bulk influence of a phytoplankton community upon its environment. Cell suspension density also determines the intercellular spacings separating phytoplankton cells from each other, or from co-occurring bacterioplankton. Intercellular spacing then determines the mean diffusion paths for exchanges of solutes among co-occurring cells. Marine phytoplankton and bacterioplankton both produce and scavenge reactive oxygen species (ROS), to maintain intracellular ROS homeostasis to support their cellular processes, while limiting damaging reactions. Among ROS, hydrogen peroxide (H2O2) has relatively low reactivity, long intracellular and extracellular lifetimes, and readily crosses cell membranes. Our objective was to quantify how cells can influence other cells via diffusional interactions, using H2O2 as a case study. To visualize and constrain potentials for cell-to-cell exchanges of H2O2, we simulated the decrease of [H2O2] outwards from representative phytoplankton taxa maintaining internal [H2O2] above representative seawater [H2O2]. [H2O2] gradients outwards from static cell surfaces were dominated by volumetric dilution, with only a negligible influence from decay. The simulated [H2O2] fell to background [H2O2] within ~3.1 µm from a Prochlorococcus cell surface, but extended outwards 90 µm from a diatom cell surface. More rapid decays of other, less stable ROS, would lower these threshold distances. Bacterioplankton lowered simulated local [H2O2] below background only out to 1.2 µm from the surface of a static cell, even though bacterioplankton collectively act to influence seawater ROS. These small diffusional spheres around cells mean that direct cell-to-cell exchange of H2O2 is unlikely in oligotrophic habits with widely spaced, small cells; moderate in eutrophic habits with shorter cell-to-cell spacing; but extensive within phytoplankton colonies.

Keywords: bacterioplankton; diffusional interactions; hydrogen peroxide; phytoplankton.


Conflict of interest statement

The authors declare no conflict of interest.

Figures

Figure 1
Figure 1
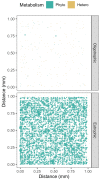
Phytoplankton and heterotrophic bacteria spacing from eutrophic or oligotrophic environments, with cell size on the same scaling as the 1 mm XY spatial axes. A 1 mm Z spatial axis is coded with fainter points farther back.
Figure 2
Figure 2
Estimates of concentration gradients of [H2O2] vs. distance outwards from ‘heterotrophic’ Bacterioplankton cell maintaining an internal [H2O2] below seawater background [H2O2] (blue band); or outwards from ‘Phytoplankton’ cells of different radii, maintaining an internal [H2O2] equal to 1/10 the cytotoxic threshold for [H2O2]. Orange indicates cytotoxic concentration range for [H2O2] (1 × 10⁻⁵ to 1 × 10⁻⁴ M). Black points show modelled [H2O2] under the influence of dilution alone. Red points show modelled [H2O2] under superimposed influences of dilution and (negligible) decay of H2O2. Vertical green lines indicate the cell surface. Vertical dashed lines indicate threshold radii out from cells, where [H2O2] around the cell falls or rises to seawater background levels. Beyond that threshold, the cell has no specific, local influence upon seawater [H2O2].
Figure 3
Figure 3
Simulations of [H2O2] above seawater [H2O2] (pale blue) out from Phytoplankton cells (green spheres, spanning a size range), or [H2O2] below seawater [H2O2] out from Bacterioplankton cells (red spheres, single nominal cell size). Cell position along a third Z axis is simulated by the ‘alpha’ with lighter cells further back.
Figure 4
Figure 4
Simulation of [H2O2] above seawater [H2O2] within a Phaeocystis colony. Note the expansion of the axes scales to 0.1 mm. Cell position along a third Z axis is simulated by the ‘alpha’ with lighter cells further back.
Figure 5
Figure 5
Thresholds for direct phytoplankton cell-to-cell interaction through [H2O2] above seawater background. The X axis shows a range of cell m−3 (which in turn governs cell-to-cell distances), while the Y axis shows radii for cell-specific spheres of influence upon [H2O2] (a function of cell size, intracellular [H2O2] and seawater [H2O2]). The areas below the threshold lines show combinations where phytoplankton cell-to-cell distance exceeds the cell-specific [H2O2] distance, so direct cell-to-cell interactions mediated by [H2O2] are unlikely. The area above the threshold lines show combinations where phytoplankton cell-to-cell distance is less than the cell-specific [H2O2] distance, so direct cell-to-cell interactions mediated by [H2O2] are feasible. The four threshold lines refer to a range of ratios of phytoplankton intracellular to extracellular [H2O2]. Data points from different habitats show that direct phytoplankton cell-to-cell interactions are likely only within the Phaeocystis colony, whereas single phytoplankton cells are generally too small or too distant for direct interactions.
Figure 6
Figure 6
Thresholds for direct bacterioplankton cell-to-cell interaction through [H2O2] above seawater background. The X axis shows a range of cell m−3 (which in turn governs cell-to-cell distances), while the Y axis shows radii for cell-specific spheres of influence upon [H2O2] (a function of cell size, intracellular [H2O2] and seawater [H2O2]). The areas below the threshold lines show combinations where bacterioplankton cell-to-cell distance exceeds the cell-specific [H2O2] distance, so direct cell-to-cell interactions mediated by [H2O2] are unlikely. The area above the threshold lines show combinations where bacterioplankton cell-to-cell distance is less than the cell-specific [H2O2] distance, so direct cell-to-cell interactions mediated by [H2O2] are feasible. The four threshold lines refer to a range of ratios of bacterioplankton intracellular to extracellular [H2O2]. Data points from different habitats show that direct bacterioplankton cell-to-cell interactions are likely, over a range of reasonable ratios of intracellular to extracellular [H2O2], at >1010 cells m−3.

Similar articles

Cited by

References

    1. Reynolds C.S. The Ecology of Phytoplankton. Cambridge University Press; Cambridge, UK: 2006.
    1. Falkowski P.G., Katz M.E., Knoll A.H., Quigg A., Raven J.A., Schofield O., Taylor F.J.R. The Evolution of Modern Eukaryotic Phytoplankton. Sci. Wash. 2004;305:354–360. doi: 10.1126/science.1095964. - DOI - PubMed
    1. Purcell E.M. Life at Low Reynolds Number. Am. J. Phys. 1976;45:3–11. doi: 10.1119/1.10903. - DOI
    1. Finkel Z.V., Beardall J., Flynn K.J., Quigg A., Rees T.A.V., Raven J.A. Phytoplankton in a Changing World: Cell Size and Elemental Stoichiometry. J. Plankton Res. 2010;32:119–137. doi: 10.1093/plankt/fbp098. - DOI
    1. Stolte W., Riegman R. Effect of Phytoplankton Cell Size on Transient-State Nitrate and Ammonium Uptake Kinetics. Microbiology. 1995;141:1221–1229. doi: 10.1099/13500872-141-5-1221. - DOI - PubMed

LinkOut - more resources