. 2022 Apr 11;23(8):4198.
doi: 10.3390/ijms23084198.

Investigating Biomarkers for USH2A Retinopathy Using Multimodal Retinal Imaging

Affiliations

Investigating Biomarkers for USH2A Retinopathy Using Multimodal Retinal Imaging

Jasdeep S Gill et al. Int J Mol Sci. .

Abstract

Pathogenic mutations in USH2A are a leading cause of visual loss secondary to non-syndromic or Usher syndrome-associated retinitis pigmentosa (RP). With an increasing number of RP-targeted clinical trials in progress, we sought to evaluate the photoreceptor topography underlying patterns of loss observed on clinical retinal imaging to guide surrogate endpoint selection in USH2A retinopathy. In this prospective cross-sectional study, twenty-five patients with molecularly confirmed USH2A-RP underwent fundus autofluorescence (FAF), spectral-domain optical coherence tomography (SD-OCT) and adaptive optics scanning laser ophthalmoscopy (AOSLO) retinal imaging. Analysis comprised measurement of FAF horizontal inner (IR) and outer (OR) hyperautofluorescent ring diameter; SD-OCT ellipsoid zone (EZ) and external limiting membrane (ELM) width, normalised EZ reflectance; AOSLO foveal cone density and intact macular photoreceptor mosaic (IMPM) diameter. Thirty-two eyes from 16 patients (mean age ± SD, 36.0 ± 14.2 years) with USH2A-associated Usher syndrome type 2 (n = 14) or non-syndromic RP (n = 2) met the inclusion criteria. Spatial alignment was observed between IR-EZ and OR-ELM diameters/widths (p < 0.001). The IMPM border occurred just lateral to EZ loss (p < 0.001), although sparser intact photoreceptor inner segments were detected until ELM disruption. EZ width and IR diameter displayed a biphasic relationship with cone density whereby slow cone loss occurred until retinal degeneration reached ~1350 μm from the fovea, beyond which greater reduction in cone density followed. Normalised EZ reflectance and cone density were significantly associated (p < 0.001). As the strongest correlate of cone density (p < 0.001) and best-corrected visual acuity (p < 0.001), EZ width is the most sensitive biomarker of structural and functional decline in USH2A retinopathy, rendering it a promising trial endpoint.

Keywords: USH2A; Usher syndrome; adaptive optics scanning laser ophthalmoscopy; fundus autofluorescence; retinitis pigmentosa; spectral-domain optical coherence tomography.


Conflict of interest statement

A.M.D. has received consulting fees from Boston Micromachines Corporation. The funders had no role in the design of the study; in the collection, analyses, or interpretation of data; in the writing of the manuscript, or in the decision to publish the results. The authors declare no conflict of interest.

Figures
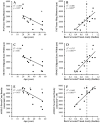
Figure 1
Figure 1
Age and functional correlation of retinal imaging in USH2A retinopathy. Scatterplots of retinal imaging metrics in association with (A,C,E) age and (B,D,F) best-corrected visual acuity (BCVA) in USH2A-associated Usher syndrome (black circles) and non-syndromic retinitis pigmentosa (grey diamonds) are shown. (A,B) Fundus autofluorescence (FAF) inner ring diameter (n = 16), (C,D) spectral-domain optical coherence tomography (SD-OCT) ellipsoid zone width (n = 15), and (E,F) adaptive optics scanning laser ophthalmoscopy (AOSLO) foveal cone density (n = 16) display the strongest correlations with age and visual function in their respective modalities. BCVA is presented in Snellen decimal format with normal defined as ≥0.80 (6/7.5) (dashed black line). A line of best fit (solid black line) is shown in each graph. R2 and p-values for each correlation are shown, with asterisks denoting the degree of statistical significance.
Figure 2
Figure 2
Spatial correlation between retinal imaging in USH2A retinopathy. Scatterplots of association between structural parameters on fundus autofluorescence (FAF), spectral-domain optical coherence tomography (SD-OCT) and adaptive optics scanning laser ophthalmoscopy (AOSLO) in USH2A-associated Usher syndrome (black circles) and non-syndromic retinitis pigmentosa (grey diamonds) are shown. (A,B) FAF versus SD-OCT shows close agreement between inner ring diameter and ellipsoid zone width (n = 15), and outer ring diameter and external limiting membrane width (n = 14). (C) SD-OCT versus AOSLO shows linear association between ellipsoid zone width and intact macular photoreceptor mosaic diameter (n = 15), similar to that in (D) FAF versus AOSLO between inner ring and intact macular photoreceptor mosaic diameters (n = 16). Lines of best fit (solid black line) and unity (x = y, dashed black line) are shown in each graph. R2 and p-values for each correlation are shown, with asterisks denoting the degree of statistical significance.
Figure 3
Figure 3
Multimodal retinal imaging in USH2A retinopathy. Fundus autofluorescence (FAF), spectral-domain optical coherence tomography (SD-OCT) and adaptive optics scanning laser ophthalmoscopy (AOSLO) images of the right eye in a 34-year-old female with USH2A-associated Usher syndrome type 2 are shown. The lateral borders of the inner (dashed yellow circle) and outer (dashed blue circle) hyperautofluorescent ring in (A) FAF spatially align with the lateral extents of the ellipsoid zone (solid yellow line) and external limiting membrane (solid blue line) bands, respectively, in the (B) SD-OCT horizontal B-scan through the foveal centre (horizontal green arrow). A magnified view of the (C) confocal and (D) split-detection AOSLO montage at the hyperautofluorescent ring (white rectangle) shows regular cone inner segments (vertical green arrows) until generalised disruption of the photoreceptor mosaic (vertical black arrow), beyond which cells are sparser (vertical amber arrow) followed by complete loss outside the outer ring (vertical red arrow).
Figure 4
Figure 4
Clinical retinal imaging correlation with photoreceptor density in USH2A retinopathy. Scatterplots of metrics from (A,B) spectral-domain optical coherence tomography (SD-OCT) and (C) fundus autofluorescence (FAF) imaging in association with foveal cone density in USH2A-associated Usher syndrome (black circles) and non-syndromic retinitis pigmentosa (grey diamonds) are shown. (A) SD-OCT ellipsoid zone width (n = 15) and (C) FAF inner ring diameter (n = 16) demonstrate a biphasic relationship with foveal cone density, whereby reduction to ~2700 μm is associated with slow cone loss (dashed black line) below which faster decline in cone density occurs (solid black line). (B) SD-OCT normalised ellipsoid zone reflectance (n = 16) displays linear correlation with foveal cone density, with a line of best fit shown (solid black line).
Figure 5
Figure 5
Spectral-domain optical coherence tomography (SD-OCT) image analysis. SD-OCT imaging of the right eye in a 54-year-old female with USH2A-associated non-syndromic retinitis pigmentosa is shown. A horizontal B-scan through the foveal centre is used in (A) logarithmic form for outer retinal band width measurement, and (B) linear form for longitudinal reflectivity profile (LRP) analysis. External limiting membrane (ELM, solid blue line) and ellipsoid zone (EZ, solid yellow line) widths are measured before B-scan linear transformation, after which an LRP is generated from a 1000 μm-wide window centred at the foveal pit (white rectangle). Coloured arrows indicate the retinal layers corresponding to peaks in the resulting (C) LRP trace: orange, retinal nerve fibre layer (RNFL); pink, inner nuclear layer (INL); blue, ELM; yellow, EZ; green, interdigitation zone (IZ); purple, retinal pigment epithelium (RPE).
Figure 6
Figure 6
Adaptive optics scanning laser ophthalmoscopy (AOSLO) cone density analysis. AOSLO imaging of the right eye in a 33-year-old female with USH2A-associated non-syndromic retinitis pigmentosa is shown. (A) 1.5° field of view confocal photoreceptor mosaic with a 100 × 100 μm cone sampling window (solid white square) applied at 100 μm eccentricity to generate (B) a region of interest (ROI). A magnified section of the ROI (dashed white square) is displayed in (C) confocal and (D) split-detection modalities, with (E) manual cone identification (blue circles) performed in the former.

References

    1. Hartong D.T., Berson E.L., Dryja T.P. Retinitis pigmentosa. Lancet. 2006;368:1795–1809. doi: 10.1016/S0140-6736(06)69740-7. - DOI - PubMed
    1. Boughman J.A., Vernon M., Shaver K.A. Usher syndrome: Definition and estimate of prevalence from two high-risk populations. J. Chronic Dis. 1983;36:595–603. doi: 10.1016/0021-9681(83)90147-9. - DOI - PubMed
    1. Usher C. On the inheritance of retinitis pigmentosa, with notes of cases. R. Lond. Ophthalmol. Hosp. Rep. 1914;19:130–236.
    1. Vernon M. Usher’s syndrome—Deafness and progressive blindness. Clinical cases, prevention, theory and literature survey. J. Chronic Dis. 1969;22:133–151. doi: 10.1016/0021-9681(69)90055-1. - DOI - PubMed
    1. Kimberling W.J., Hildebrand M.S., Shearer A.E., Jensen M.L., Halder J.A., Trzupek K., Cohn E.S., Weleber R.G., Stone E.M., Smith R.J. Frequency of Usher syndrome in two pediatric populations: Implications for genetic screening of deaf and hard of hearing children. Genet. Med. 2010;12:512–516. doi: 10.1097/GIM.0b013e3181e5afb8. - DOI - PMC - PubMed

MeSH terms

Supplementary concepts