. 2022 Apr 13;14(8):1624.
doi: 10.3390/nu14081624.

Neither Incretin or Amino Acid Responses, nor Casein Content, Account for the Equal Insulin Response Following Iso-Lactose Loads of Natural Human and Cow Milk in Healthy Young Adults

Affiliations

Neither Incretin or Amino Acid Responses, nor Casein Content, Account for the Equal Insulin Response Following Iso-Lactose Loads of Natural Human and Cow Milk in Healthy Young Adults

Paolo Tessari et al. Nutrients. .

Abstract

Human milk contains <50% less protein (casein) than cow milk, but is equally effective in insulin secretion despite lower postingestion hyperaminoacidemia. Such potency of human milk might be modulated either by incretins (glucagon-like polypeptide-1,GLP-1); glucose-inhibitory-polypeptide, GIP), and/or by milk casein content. Healthy volunteers of both sexes were fed iso-lactose loads of two low-protein milks, i.e., human [Hum] (n = 8) and casein-deprived cow milk (Cow [↓Cas]) (n = 10), as well as loads of two high-protein milks, i.e., cow (n = 7), and casein-added human-milk (Hum [↑Cas]) (n = 7). Plasma glucose, insulin, C-peptide, incretins and amino acid concentrations were measured for 240′. All milks induced the same transient hyperglycemia. The early [20′−30′] insulin and C-peptide responses were comparable among all milk types apart from the low-protein (Cow [↓Cas]) milk, where they were reduced by <50% (p < 0.05 vs. others). When comparing the two high-protein milks, GLP-1 and GIP [5’−20’] responses with the (Hum [↑Cas]) milk were lower (by ≈2−3 fold, p < 0.007 and p < 0.03 respectively) than those with cow milk, whereas incretin secretion was substantially similar. Plasma amino acid increments largely reflected the milk protein content. Thus, neither casein milk content, nor incretin or amino acid concentrations, can account for the specific potency of human milk on insulin secretion, which remains as yet unresolved.

Keywords: amino acids; casein; cow milk; dietary supplements; human milk; incretin; insulin; whey proteins.


Conflict of interest statement

The authors declare no conflict of interest.

Figures

Figure A1
Figure A1
Polyacrylamide gel electrophoresis of human and cow milk samples. The quantities reported in the Legend are those of the protein amount loaded. The MW values reported on the first lane (from the left) are those of the reference MW standards used, those on the left the MW of the listed proteins. Abbreviations used: MW = molecular weight; kD = kiloDalton.
Figure 1
Figure 1
Schematic protein composition of the milk types employed in the study. The Y axis reports the protein concentrations (g/100 mL) of each milk type. The (approximate) casein (Cas) and whey protein (WP) concentrations are reported as either yellow (lower) or brown (upper) part of the main bars. Abbreviations: Cas: casein; Hum: human; Cow [↓Cas]: low-casein cow milk; Hum [↑Cas]: high-casein human milk; WP: whey protein; WP/Cas: whey protein to casein ratio.
Figure 2
Figure 2
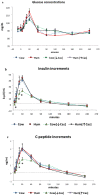
Glucose, insulin, and C-peptide. Abbreviations: Hum: human; Cow [↓Cas]: low-casein cow milk; Hum [↑Cas]: high-casein human milk; WP: whey protein. (a): Plasma glucose concentrations (expressed as mg/dL) before and following milk administration over the 240 min study period. Data are mean ± SEM. No significant differences between the four milk types were detected at any time points. Sample size: Cow, n = 7; Hum, n = 8; Cow [↓Cas], n = 10; and Hum [↑Cas], n = 7. (b): Increments vs. basal values of plasma insulin concentrations (expressed as Δ μU/mL) following milk administration over the 240 min study period. Data are reported as mean ± SEM. The symbol (*) indicates the level(s) of the statistical differences (by 2-way ANOVA and the Fisher’s LSD test) between the Cow [↓Cas] milk and Cow milk at 10′ (p < 0.04), as well as between the Cow [↓Cas] milk and either Cow (p < 0.006 and p < 0.015), or the Hum (p < 0.05 and p < 0.025) milk at 20′ and 30′ respectively. Sample size: Cow, n = 7; Hum, n = 8; Cow [↓Cas], n = 10; and Hum [↑Cas], n = 7. (c): Increments vs. basal values of plasma C-peptide concentrations (expressed as Δ ng/mL) following milk administration over the 240 min study period. Data are reported as mean ± SEM. The symbol (*) indicates the level(s) of the statistical difference (by two-way ANOVA and the Fisher’s LSD test) at 20′ and 30′ between the Cow [↓Cas] milk and either the Cow (p < 0.012 and p < 0.016, respectively), the Hum (p = 0.067 and p < 0.005, respectively) or the Hum [↑Cas] milk (p < 0.01 and p < 0.004, respectively). Sample size: Cow, n = 7; Hum, n = 8; Cow [↓Cas], n = 10; and Hum [↑Cas], n = 7.
Figure 3
Figure 3
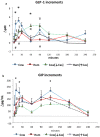
GLP-1 and GIP. Abbreviations: GIP: glucose-inhibitory-polypeptide; GLP-1: glucagon-like polypeptide-1; Hum: human; Cow [↓Cas]: low-casein cow milk; Hum [↑Cas]: high-casein human milk. (a): Increments vs. baseline values of plasma GLP-1 concentrations (expressed as Δ pM/mL) following milk administration over the 240 min study period. Data are means ± SEM. The symbols indicate the statistical difference (by two-way ANOVA the Fisher’s LSD test): (*) at 10′, 20′ and at 60′ between Cow [n = 7] and Cow [↓Cas] milk (n = 9) (p = 0.025, p < 0.04, and p < 0.002, respectively); [#] at 10′, 20′ and 90′ between Cow [n = 7], and Hum [n = 7] milk (p = 0.002, p < 0.0015, p = 0.066); [§] at 10′ and 20′ between Cow [n = 7] and Hum [↑Cas] [n = 6] milk (p < 0.002 and p < 0.04, respectively); and finally [¤] between Hum [n = 7] and Cow [↓Cas] milk [n = 9] at 60′ and 90′ (p < 0.005 at both time points) (by two-way ANOVA the Fisher’s LSD test). (b): Increments vs. baseline values of plasma GIP concentrations (expressed as Δ pM/mL) following milk administration over the 240 min study period. Data are means ± SEM. The symbols indicate the levels of statistical difference (by two-way ANOVA the Fisher’s LSD test): (*) at 10′, 20′ and 120′ between Cow [n = 7] and the Cow [↓Cas] milk [n = 9] (p < 0.0001, p = 0.015 and p < 0.02 respectively); at 10′ between the Cow [n = 7] and either [§] the Hum [n = 7] (p < 0.02) or the [#] Hum [↑Cas] [n = 6] (p = 0.001) milk.
Figure 4
Figure 4
GLP-1 and GIP incremental areas. Abbreviations: GIP: glucose-inhibitory-polypeptide; GLP-1: glucagon-like polypeptide-1; Hum: human; Cow [↓Cas]: low-casein cow milk; Hum [↑Cas]: high-casein human milk. (a): Integrated increments of GLP-1 vs. baseline over the [5′–20′] period. The symbols indicate significant differences between Cow milk [n = 7] and either [*] Hum (n = 7) (p < 0.002), [#] Cow [↓Cas] [n = 9] (p < 0.035) or [§] Hum [↑Cas] milk [n = 6] (p < 0.007) (by one-way ANOVA and the Fisher’s LSD test). (b): Integrated increments of GIP vs. baseline over the [5′–20′] period. The symbol (*) indicates a significant difference between Cow [n = 7] and either the Cow [↓Cas] milk [n = 9] (p < 0.012) or the Hum [↑Cas] milk [n = 6] (p = 0.03) (by one-way ANOVA and the Fisher’s LSD test). (c): Integrated increments of GLP-1 vs. baseline over the [60′–240′] period. There was no significant difference among the four milk types. (d): Integrated increments of GIP vs. baseline over the [60′–240′] period. There was no significant difference among the four milk types.
Figure 5
Figure 5
Plasma amino acid increments. Abbreviations: AA: amino acids; BCAA: branched-chain AA; Phe: phenylalanine; Tyr: tyrosine; Hum: human; Cow [↓Cas]: low-casein cow milk; Hum [↑Cas]: high-casein human milk. (a): Increments vs. baseline of the sum of total amino acid [AA] concentration over the 4-h study period following milk ingestion. The symbol (*) at 5′ indicates a significant difference (by the two-way ANOVA and the Fisher’s LSD test) between Cow milk [n = 7] and either Hum [n = 7] [p < 0.02], Cow [↓Cas] [n = 10] (p < 0.025) or Hum [↑Cas] [n = 7] (p < 0.04) milk. The symbol (#) at 10′ indicates a significant different between Cow and either Hum (p < 0.025) or the Cow [↓Cas] (p < 0.03) milk (by one-way ANOVA and the Fisher’s LSD test). The symbol (§) at 60′ indicates a significant difference between the Hum [↑Cas] milk, and either Hum (p = 0.0025) or Cow [↓Cas] milk (p = 0.008), whereas that with Cow milk was of borderline significance (p = 0.075) (by one-way ANOVA and the Fisher’s LSD test). (b): Increments vs. baseline of the sum of branched-chain amino acids (BCAA) concentration over the 4 h study period following milk ingestion. The symbol (*) at 20′ indicates a significant difference (by one-way ANOVA and the Fisher’s LSD test) between the Hum [↑Cas] [n = 7] milk and either Hum [n = 7] (p < 0.035) or Cow [↓Cas] [n = 10] (p < 0.016) milks. The symbol (#) at 60′ indicates a significant difference between the Hum [↑Cas] milk and either Hum [p < 0.005] or Cow [↓Cas] (p = 0.05) milks. The symbol (§) at 90′ indicates a significant difference between the Hum [↑Cas] milk and either Hum (p < 0.001) or Cow [↓Cas] [p < 0.003] milk (by one-way ANOVA and the Fisher’s LSD test). (c): Sum of concentration increments vs. baseline of phenylalanine [Phe] and tyrosine [Tyr] over the 4 hours after milk ingestion. The symbol [*] at 90’ indicates a significant difference between the Hum [↑Cas] [n = 7] milk and either the Cow [↓Cas] [n = 10] (p < 0.001) or the Cow [n = 7] milk (p < 0.02). The symbol [#] at 180’ indicates a significant difference between Hum milk [n = 7] and either the Cow [=7] (p < 0.001), the Cow [↓Cas] [n = 10] (p < 0.015) or the Hum [↑Cas] milk (p = 0.02). (d): Sum of concentration increments vs. baseline of non-essential amino acids [NEAA] (alanine, glycine, proline, OH-proline, serine, cysteine, glutamic acid, tyrosine) over the 4 h after milk ingestion. There was no significant difference between the groups at any time point.
Figure 5
Figure 5
Plasma amino acid increments. Abbreviations: AA: amino acids; BCAA: branched-chain AA; Phe: phenylalanine; Tyr: tyrosine; Hum: human; Cow [↓Cas]: low-casein cow milk; Hum [↑Cas]: high-casein human milk. (a): Increments vs. baseline of the sum of total amino acid [AA] concentration over the 4-h study period following milk ingestion. The symbol (*) at 5′ indicates a significant difference (by the two-way ANOVA and the Fisher’s LSD test) between Cow milk [n = 7] and either Hum [n = 7] [p < 0.02], Cow [↓Cas] [n = 10] (p < 0.025) or Hum [↑Cas] [n = 7] (p < 0.04) milk. The symbol (#) at 10′ indicates a significant different between Cow and either Hum (p < 0.025) or the Cow [↓Cas] (p < 0.03) milk (by one-way ANOVA and the Fisher’s LSD test). The symbol (§) at 60′ indicates a significant difference between the Hum [↑Cas] milk, and either Hum (p = 0.0025) or Cow [↓Cas] milk (p = 0.008), whereas that with Cow milk was of borderline significance (p = 0.075) (by one-way ANOVA and the Fisher’s LSD test). (b): Increments vs. baseline of the sum of branched-chain amino acids (BCAA) concentration over the 4 h study period following milk ingestion. The symbol (*) at 20′ indicates a significant difference (by one-way ANOVA and the Fisher’s LSD test) between the Hum [↑Cas] [n = 7] milk and either Hum [n = 7] (p < 0.035) or Cow [↓Cas] [n = 10] (p < 0.016) milks. The symbol (#) at 60′ indicates a significant difference between the Hum [↑Cas] milk and either Hum [p < 0.005] or Cow [↓Cas] (p = 0.05) milks. The symbol (§) at 90′ indicates a significant difference between the Hum [↑Cas] milk and either Hum (p < 0.001) or Cow [↓Cas] [p < 0.003] milk (by one-way ANOVA and the Fisher’s LSD test). (c): Sum of concentration increments vs. baseline of phenylalanine [Phe] and tyrosine [Tyr] over the 4 hours after milk ingestion. The symbol [*] at 90’ indicates a significant difference between the Hum [↑Cas] [n = 7] milk and either the Cow [↓Cas] [n = 10] (p < 0.001) or the Cow [n = 7] milk (p < 0.02). The symbol [#] at 180’ indicates a significant difference between Hum milk [n = 7] and either the Cow [=7] (p < 0.001), the Cow [↓Cas] [n = 10] (p < 0.015) or the Hum [↑Cas] milk (p = 0.02). (d): Sum of concentration increments vs. baseline of non-essential amino acids [NEAA] (alanine, glycine, proline, OH-proline, serine, cysteine, glutamic acid, tyrosine) over the 4 h after milk ingestion. There was no significant difference between the groups at any time point.
Figure 6
Figure 6
Incremental areas of amino acids. Abbreviations: AA: amino acids; BCAA: branchedchain AA; Phe: phenylalanine; Tyr: tyrosine; Hum: human; Cow [↓Cas]: low-casein cow milk; Hum [↑Cas]: high-casein human milk. (a): Integrated incremental areas under the curve (iAUC) over baseline, of total AA concentrations, in the [0′–120′] (left full bars) and the [120′–240′] iAUC (right checkered bars) time intervals, respectively. There was no difference, among the four milk types, in either the [0′–120′] or the [120′–240′] iAUC. The [120′–240′] areas were lower (p < 0.0001) than the [0′–120′] ones (by the paired t test) in all milk groups. (b): Integrated incremental areas under the curve (iAUC) over baseline, of the BCAA concentrations, in the [0′–120′] (left full bars) and the [120′–240′] iAUC (right checkered bars) time intervals, respectively. The symbol (*) indicates a significant difference (by one-way ANOVA and the Fisher’s LSD test) between Cow and Hum milk (p < 0.03) in the [120′–240′] iAUC. The symbol (§) indicates a significant difference (p < 0.03) between Hum and Hum [↑Cas] in the [0′–120′] iAUC. The symbol (#) indicates a significant difference (p < 0.02) Cow [↓Cas] and Hum [↑Cas] in the [0′–120′] iAUC. The symbol (§§) indicates a significant difference (p < 0.04) between Hum and Hum [↑Cas] milk the [120′–240′] iAUC. The [120′–240′] areas were significantly lower (p < 0.0001) than the [0′–120′] ones (by paired t test). (c): Integrated incremental areas over baseline, of the sum of phenylalanine (Phe) and tyrosine (Tyr) concentrations, in the [0′–120′] (left bars, full colors) and the [120′–240′] (right bars, checkered-pattern colors) time intervals, respectively. The symbol (*) indicates a significant difference between Hum and Cow milk in the [120′–240′] (p < 0.003), as well as borderline-significant difference between the Hum and the Cow [-Cas] milk (p = 0.057). The [120′–240′] areas were significantly lower [p < 0.0001] than the [0′–120′] ones (by paired t test). (d): Integrated incremental areas over baseline, of the sum of non-essential amino acids (NEAA) (alanine, glycine, proline, serine, hydroxyproline, cysteine, glutamate, tyrosine), in the [0′–120′] (left bars, full colors) and the [120′–240′] (right bars, checkered-pattern colors) time intervals, respectively. There were no differences in the iAUC in any study group. The [120′–240′] areas were lower (p = 0.001) than [0′–120′] ones (by the paired t test) in each experimental group except for the Cow milk group.
Figure 6
Figure 6
Incremental areas of amino acids. Abbreviations: AA: amino acids; BCAA: branchedchain AA; Phe: phenylalanine; Tyr: tyrosine; Hum: human; Cow [↓Cas]: low-casein cow milk; Hum [↑Cas]: high-casein human milk. (a): Integrated incremental areas under the curve (iAUC) over baseline, of total AA concentrations, in the [0′–120′] (left full bars) and the [120′–240′] iAUC (right checkered bars) time intervals, respectively. There was no difference, among the four milk types, in either the [0′–120′] or the [120′–240′] iAUC. The [120′–240′] areas were lower (p < 0.0001) than the [0′–120′] ones (by the paired t test) in all milk groups. (b): Integrated incremental areas under the curve (iAUC) over baseline, of the BCAA concentrations, in the [0′–120′] (left full bars) and the [120′–240′] iAUC (right checkered bars) time intervals, respectively. The symbol (*) indicates a significant difference (by one-way ANOVA and the Fisher’s LSD test) between Cow and Hum milk (p < 0.03) in the [120′–240′] iAUC. The symbol (§) indicates a significant difference (p < 0.03) between Hum and Hum [↑Cas] in the [0′–120′] iAUC. The symbol (#) indicates a significant difference (p < 0.02) Cow [↓Cas] and Hum [↑Cas] in the [0′–120′] iAUC. The symbol (§§) indicates a significant difference (p < 0.04) between Hum and Hum [↑Cas] milk the [120′–240′] iAUC. The [120′–240′] areas were significantly lower (p < 0.0001) than the [0′–120′] ones (by paired t test). (c): Integrated incremental areas over baseline, of the sum of phenylalanine (Phe) and tyrosine (Tyr) concentrations, in the [0′–120′] (left bars, full colors) and the [120′–240′] (right bars, checkered-pattern colors) time intervals, respectively. The symbol (*) indicates a significant difference between Hum and Cow milk in the [120′–240′] (p < 0.003), as well as borderline-significant difference between the Hum and the Cow [-Cas] milk (p = 0.057). The [120′–240′] areas were significantly lower [p < 0.0001] than the [0′–120′] ones (by paired t test). (d): Integrated incremental areas over baseline, of the sum of non-essential amino acids (NEAA) (alanine, glycine, proline, serine, hydroxyproline, cysteine, glutamate, tyrosine), in the [0′–120′] (left bars, full colors) and the [120′–240′] (right bars, checkered-pattern colors) time intervals, respectively. There were no differences in the iAUC in any study group. The [120′–240′] areas were lower (p = 0.001) than [0′–120′] ones (by the paired t test) in each experimental group except for the Cow milk group.

References

    1. Pereira P.C. Milk nutritional composition and its role in human health. Nutrition. 2014;30:619–627. doi: 10.1016/j.nut.2013.10.011. - DOI - PubMed
    1. Hartmann R., Meisel H. Food-derived peptides with biological activity: From research to food applications. Curr. Opin. Biotechnol. 2007;18:163–169. doi: 10.1016/j.copbio.2007.01.013. - DOI - PubMed
    1. Madureira A., Tavares T., Gomes A., Pintado M., Malcata F. Invited review: Physiological properties of bioactive peptides obtained from whey proteins. J. Dairy Sci. 2010;93:437–455. doi: 10.3168/jds.2009-2566. - DOI - PubMed
    1. Li Y., Fan Y., Shaikh A.S., Wang Z., Wang D., Tan H. Dezhou donkey (Equus asinus) milk a potential treatment strategy for type 2 diabetes. J. Ethnopharmacol. 2019;246:112221. doi: 10.1016/j.jep.2019.112221. - DOI - PubMed
    1. Lionetti L., Cavaliere G., Bergamo P., Trinchese G., De Filippo C., Gifuni G., Gaita M., Pignalosa A., Donizzetti I., Putti R., et al. Diet supplementation with donkey milk upregulates liver mitochondrial uncoupling, reduces energy efficiency and improves antioxidant and antiinflammatory defences in rats. Mol. Nutr. Food Res. 2012;56:1596–1600. doi: 10.1002/mnfr.201200160. - DOI - PubMed