. 2022 Apr 15;14(8):1648.
doi: 10.3390/nu14081648.

The Dose-Response Effects of Consuming High Fructose Corn Syrup-Sweetened Beverages on Hepatic Lipid Content and Insulin Sensitivity in Young Adults

Affiliations

The Dose-Response Effects of Consuming High Fructose Corn Syrup-Sweetened Beverages on Hepatic Lipid Content and Insulin Sensitivity in Young Adults

Desiree M Sigala et al. Nutrients. .

Abstract

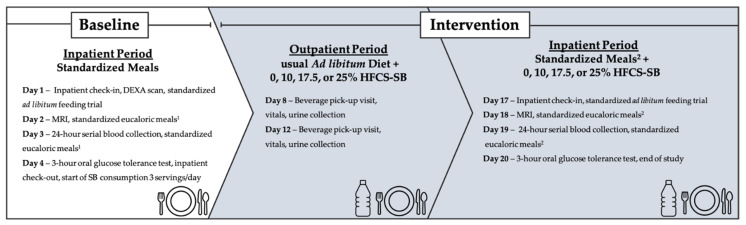
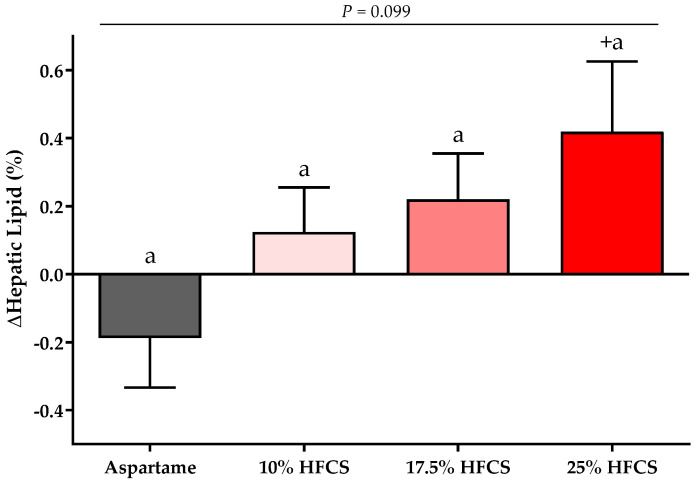
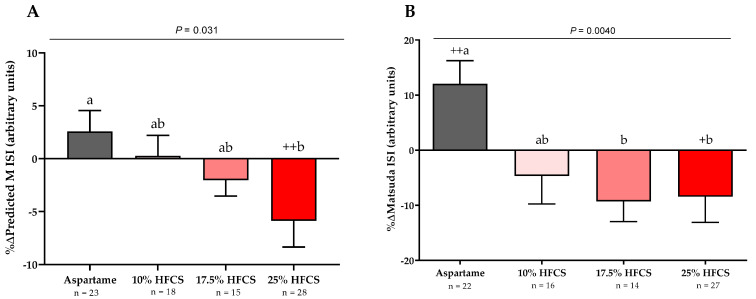
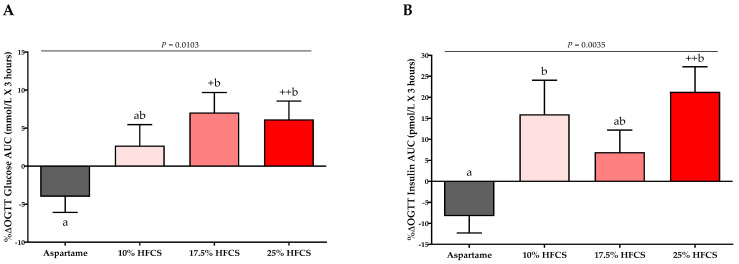
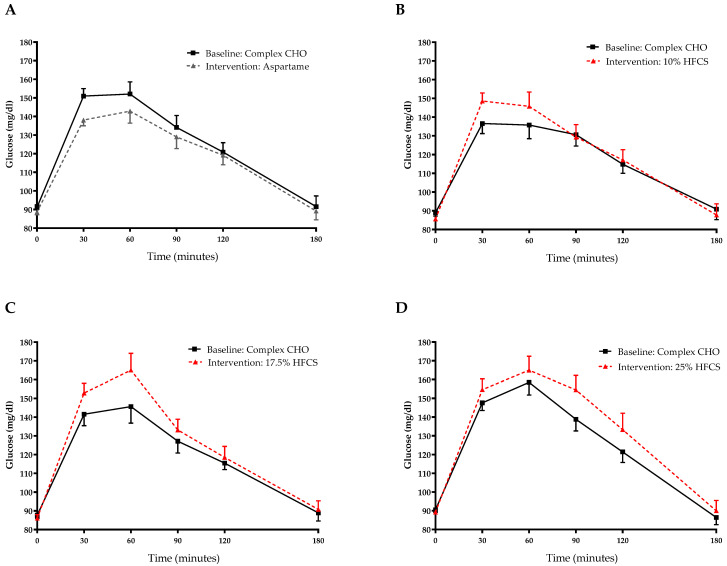
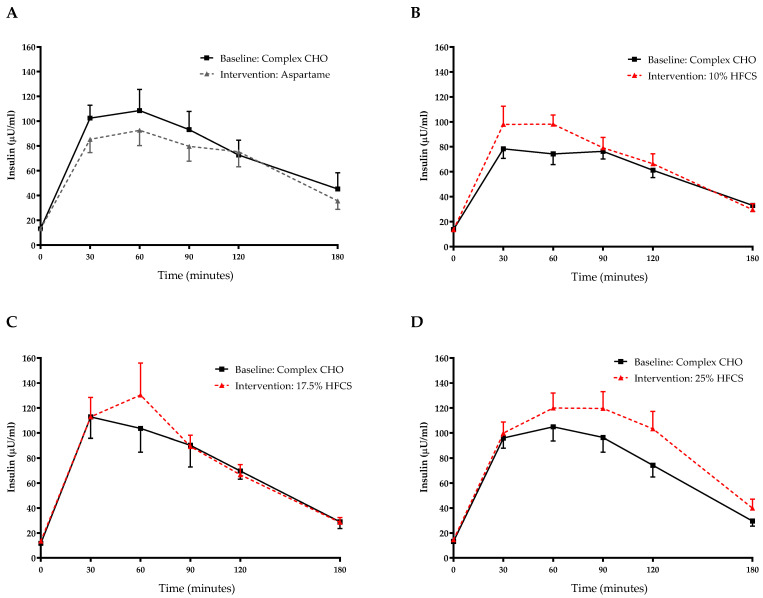
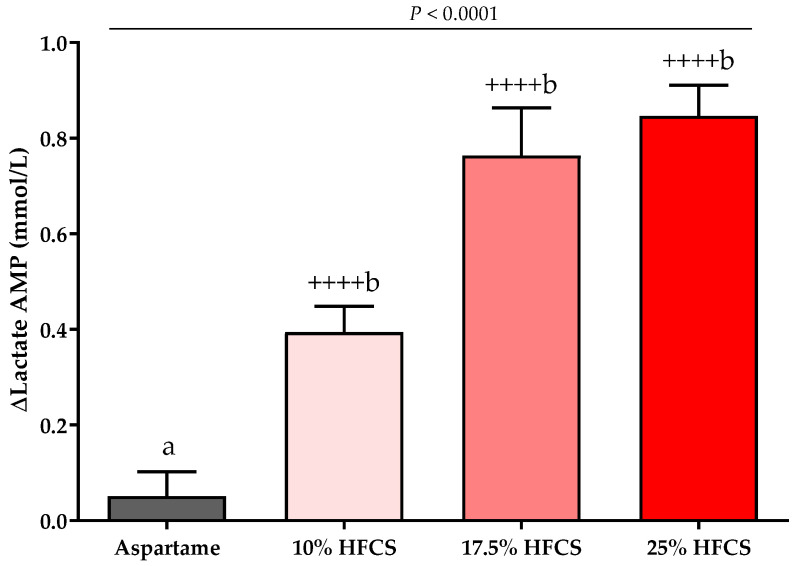
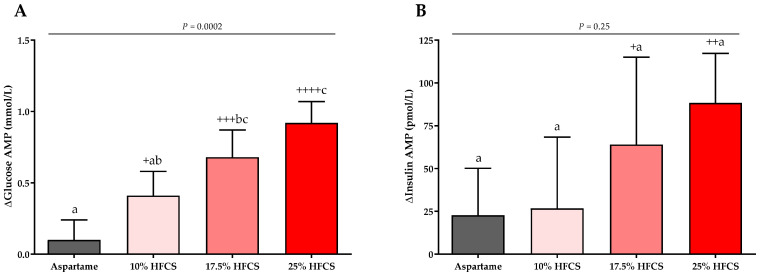
Increased hepatic lipid content and decreased insulin sensitivity have critical roles in the development of cardiometabolic diseases. Therefore, our objective was to investigate the dose-response effects of consuming high fructose corn syrup (HFCS)-sweetened beverages for two weeks on hepatic lipid content and insulin sensitivity in young (18-40 years) adults (BMI 18-35 kg/m2). In a parallel, double-blinded study, participants consumed three beverages/day providing 0% (aspartame: n = 23), 10% (n = 18), 17.5% (n = 16), or 25% (n = 28) daily energy requirements from HFCS. Magnetic resonance imaging for hepatic lipid content and oral glucose tolerance tests (OGTT) were conducted during 3.5-day inpatient visits at baseline and again at the end of a 15-day intervention. During the 12 intervening outpatient days participants consumed their usual diets with their assigned beverages. Significant linear dose-response effects were observed for increases of hepatic lipid content (p = 0.015) and glucose and insulin AUCs during OGTT (both p = 0.0004), and for decreases in the Matsuda (p = 0.0087) and Predicted M (p = 0.0027) indices of insulin sensitivity. These dose-response effects strengthen the mechanistic evidence implicating consumption of HFCS-sweetened beverages as a contributor to the metabolic dysregulation that increases risk for nonalcoholic fatty liver disease and type 2 diabetes.

Keywords: high-fructose corn syrup; insulin sensitivity; lactate; liver fat; sugar-sweetened beverages.


Conflict of interest statement

V.M. serves in the Advisory board of Alexion Pharmaceuticals. M.I.G. serves as Scientific Advisor to Yumi infant food and receives royalties for Sugarproof published by Penguin Random House. C.S. reports grants from GE, Siemens, Philips, Bayer, Foundation of NIH, Gilead, and Pfizer (grant is to UW-Madison; UCSD is a subcontract to UW-Madison); personal consultation fees from Blade, Boehringer, and Epigenomics; consultation under the auspices of the University to AMRA, BMS, Exact Sciences, GE Digital, IBM-Watson, and Pfizer; lab service agreements from Enanta, Gilead, ICON, Intercept, Nusirt, Shire, Synageva, Takeda; royalties from Wolters Kluwer for educational material outside the submitted work; honoraria to the institution from Medscape for educational material outside the submitted work; ownership of stock options in Livivos; unpaid position in advisory board to Quantix Bio. All other authors have no conflict of interest to declare.

Figures

Figure 1
Figure 1
Study design and experimental testing and collection days. DEXA, dual energy X-ray absorptiometry; MRI, magnetic resonance imaging; SB, sweetened beverage; HFCS, high fructose corn syrup. 1 Fifty-five percent complex carbohydrate (<2%added sugar), 35% fat, 15% protein. 2 55–30% complex carbohydrate (depending on assigned SB, <2%added sugar), 35% fat, 15% protein. % = % of energy requirement.
Figure 2
Figure 2
Changes in hepatic lipid content: Mean ± SEM of the absolute change (intervention − baseline) of hepatic lipid content in participants consuming 0 (n = 20), 10 (n = 16), 17.5 (n = 16), or 25% (n = 23) HFCS-sweetened beverages for two weeks. p = the effect of HFCS group, two-factor (HFCS group, sex) ANCOVA with adjustment for MSRF and outcome at baseline; + p < 0.05, LS mean different from zero.
Figure 3
Figure 3
Changes in Predicted M ISI and Matsuda ISI: Mean ± SEM of the % changes in (A) Predicted M Insulin Sensitivity Index (ISI) in participants consuming 0 (n = 22), 10 (n = 16), 17.5 (n = 14), or 25% (n = 27) and (B) Matsuda ISI in participants consuming 0 (n = 23), 10 (n = 18), 17.5 (n = 15), or 25% (n = 28) HFCS-sweetened beverages for two weeks. p = effect of HFCS group, two-factor (HFCS group, sex) ANCOVA with adjustment for MSRF; + p < 0.5, ++ p < 0.01, LS mean different from zero; a different from b, Tukey’s.
Figure 4
Figure 4
Percent changes in 3-h glucose and insulin AUC: Mean ± SEM of the % change in glucose (A) and insulin (B) AUC during OGTT in participants consuming 0 (n = 23), 10 (n = 18), 17.5 (n = 15), or 25% (n = 28) HFCS-sweetened beverages for the two-week intervention. p = effect of HFCS group, two-factor (HFCS group, sex) ANCOVA with adjustment for MSRF; +p < 0.05, ++ p < 0.01, LS mean different from zero; a different from b, Tukey’s.
Figure 5
Figure 5
Plasma glucose excursions during 3-h OGTT: Glucose concentrations during OGTT at baseline and after consuming 0 (n = 23) (A), 10 (n = 18) (B), 17.5 (n = 15) (C), or 25% (n = 28) (D) HFCS-sweetened beverages for the two-week intervention. CHO, carbohydrate; HFCS, high-fructose corn syrup.
Figure 6
Figure 6
Plasma insulin excursions during 3-h OGTT: Insulin concentrations during OGTT at baseline and after consuming 0 (n = 23) (A), 10 (n = 18) (B), 17.5 (n = 15) (C), or 25% (n = 28) (D) HFCS-sweetened beverages for the two-week intervention.
Figure 7
Figure 7
Changes in lactate amplitudes (AMP): Mean ± SEM of the absolute change (intervention − baseline) in lactate amplitudes in participants consuming 0 (n = 23), 10 (n = 18), 17.5 (n = 15), or 25% (n = 28) HFCS-sweetened beverages for the two-week intervention. p = the effect of SB group, two-factor (HFCS group, sex) ANCOVA with adjustment for MSRF and outcome at baseline; ++++ p < 0.0001, LS mean different from zero; a different from b, Tukey’s.
Figure 8
Figure 8
Changes in glucose and insulin amplitudes (AMP): Mean ± SEM of the absolute changes (intervention − baseline) in glucose (A) and insulin AMPs (B) in participants consuming 0 (n = 23), 10 (n = 18), 17.5 (n = 15), or 25% (n = 28) HFCS-sweetened beverages for the two-week intervention. p = effect of HFCS group, two-factor (HFCS group, sex) ANCOVA with adjustment for MSRF and outcome at baseline; + p < 0.05, ++ p < 0.01, +++ p < 0.001, ++++ p < 0.0001, LS mean different from zero; a different from b, Tukey’s.

Similar articles

Cited by

References

    1. Interntional Diabetes Federation IDF Diabetes Atlas: 10th Edition. [(accessed on 15 November 2021)]. Available online: http://www.diabetesatlas.org.
    1. Zimmet P., Alberti K.G., Shaw J. Global and societal implications of the diabetes epidemic. Nature. 2001;414:782–787. doi: 10.1038/414782a. - DOI - PubMed
    1. Li J., Zou B., Yeo Y.H., Feng Y., Xie X., Lee D.H., Fujii H., Wu Y., Kam L.Y., Ji F., et al. Prevalence, incidence, and outcome of non-alcoholic fatty liver disease in Asia, 1999–2019: A systematic review and meta-analysis. Lancet Gastroenterol. Hepatol. 2019;4:389–398. doi: 10.1016/S2468-1253(19)30039-1. - DOI - PubMed
    1. Younossi Z.M., Koenig A.B., Abdelatif D., Fazel Y., Henry L., Wymer M. Global epidemiology of nonalcoholic fatty liver disease-Meta-analytic assessment of prevalence, incidence, and outcomes. Hepatology. 2016;64:73–84. doi: 10.1002/hep.28431. - DOI - PubMed
    1. Ciardullo S., Perseghin G. Prevalence of NAFLD, MAFLD and associated advanced fibrosis in the contemporary United States population. Liver Int. 2021;41:1290–1293. doi: 10.1111/liv.14828. - DOI - PubMed