. 2022 Mar 27;14(4):691.
doi: 10.3390/v14040691.

Mapping the Distributions of Mosquitoes and Mosquito-Borne Arboviruses in China

Affiliations

Mapping the Distributions of Mosquitoes and Mosquito-Borne Arboviruses in China

Tao Wang et al. Viruses. .

Abstract

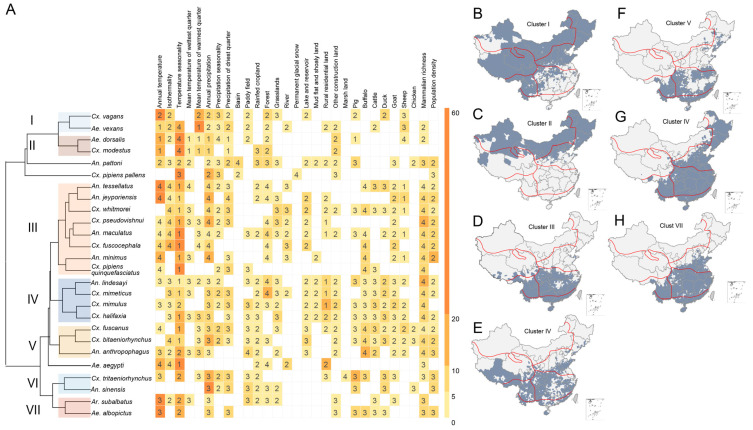
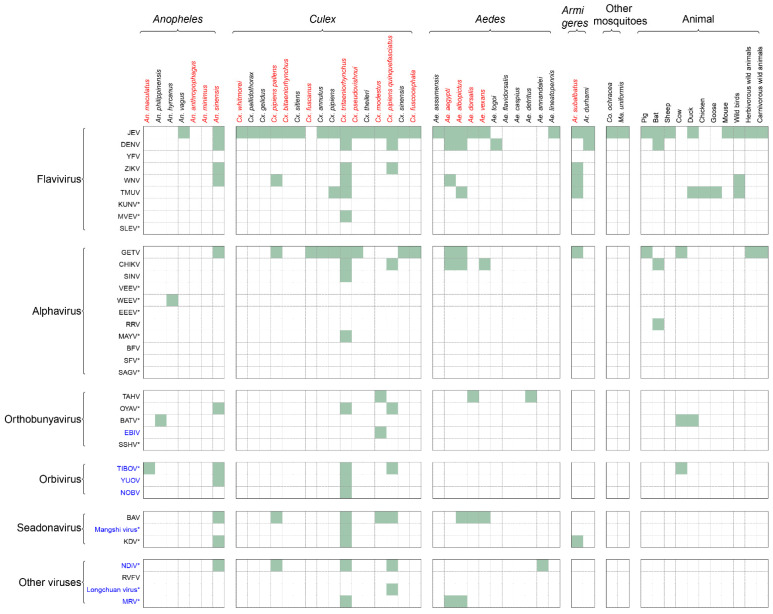
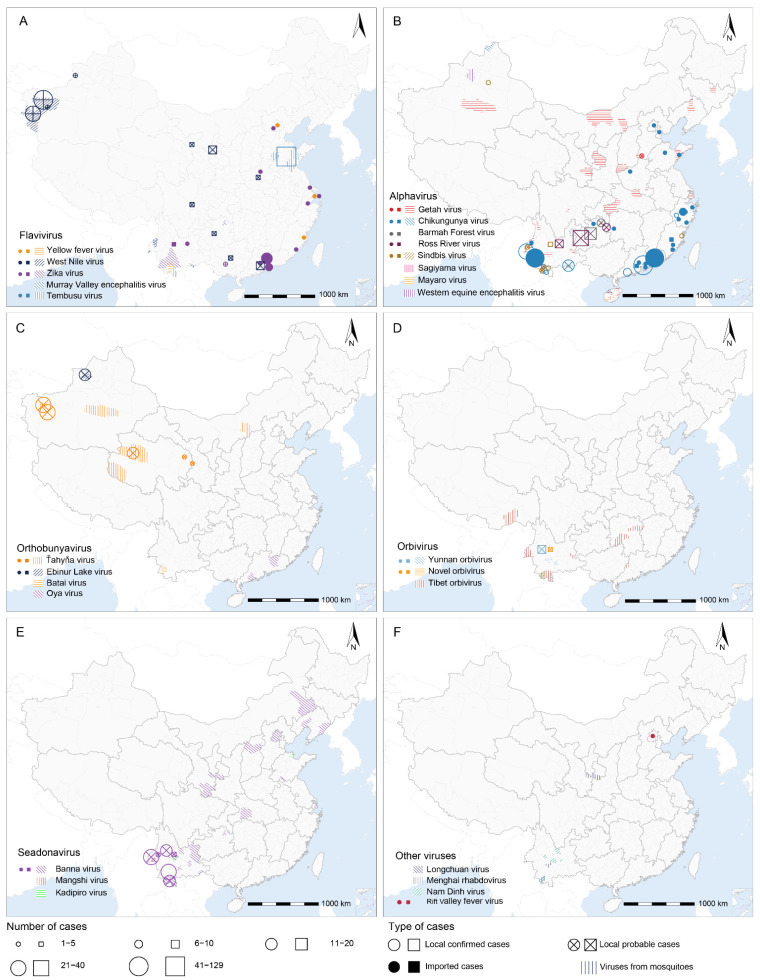
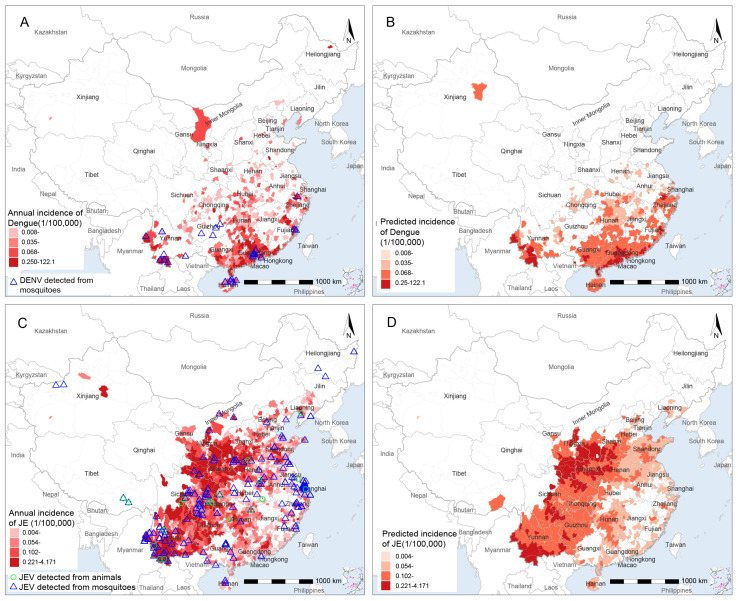
The geographic expansion of mosquitos is associated with a rising frequency of outbreaks of mosquito-borne diseases (MBD) worldwide. We collected occurrence locations and times of mosquito species, mosquito-borne arboviruses, and MBDs in the mainland of China in 1954-2020. We mapped the spatial distributions of mosquitoes and arboviruses at the county level, and we used machine learning algorithms to assess contributions of ecoclimatic, socioenvironmental, and biological factors to the spatial distributions of 26 predominant mosquito species and two MBDs associated with high disease burden. Altogether, 339 mosquito species and 35 arboviruses were mapped at the county level. Culex tritaeniorhynchus is found to harbor the highest variety of arboviruses (19 species), followed by Anopheles sinensis (11) and Culex pipiens quinquefasciatus (9). Temperature seasonality, annual precipitation, and mammalian richness were the three most important contributors to the spatial distributions of most of the 26 predominant mosquito species. The model-predicted suitable habitats are 60-664% larger in size than what have been observed, indicating the possibility of severe under-detection. The spatial distribution of major mosquito species in China is likely to be under-estimated by current field observations. More active surveillance is needed to investigate the mosquito species in specific areas where investigation is missing but model-predicted probability is high.

Keywords: China; arboviruses; distribution; mosquito-borne diseases; mosquitoes; risk determinants.


Conflict of interest statement

The authors declare no conflict of interest.

Figures

Figure 1
Figure 1
Clustering of mosquito species based on their ecological features and spatial distributions at the county level. Panels (BH) indicate the spatial distributions of the seven clusters (clusters I–VII). The boundaries of the seven biogeographic zones are shown as red solid lines. The dendrogram in panel (A) displays the clusters I–VII of mosquito species. The features used for clustering are three quantities associated with each predictor in the BRT models. Two of the three quantities were displayed in panel (A) to indicate the possible level of ecological suitability: relative contributions (colors in ascending order from yellow to orange) and standardized median value of the predictor (numbers in the heatmap) among counties with mosquito occurrence (numbers 1–4 indicate the position of this median in reference to the quartiles of this predictor among all counties).
Figure 2
Figure 2
Mosquito species and animals for mosquito-borne viruses in China from 1954 to 2020. The virus names colored in blue indicate newly identified pathogens in the past two decades in China. “*” indicates arboviruses that have never been reported in human cases in China, but with the detection of viruses in mosquitoes or animals, or the detection of IgG in people. The mosquito names colored in red indicate species included in ecological models.
Figure 3
Figure 3
Distributions of reported human cases (circles or squares) and viral detections from mosquitos (shaded areas) of (A) Flavivirus; (B) Alphavirus; (C) Orthobunyavirus; (D) Orbivirus; (E) Seadonavirus and (F) other viruses in China in 1954–2020. Local confirmed (hollow circles or squares), local probable (hollow circles or squares with a cross), and imported (solid circles or squares) human cases are positioned at the center of prefectures/counties (circles) or provinces (square), depending on the finest available resolution. Human cases of JEV and DENV are not shown, as they are described in other figures. Source data are provided in Supplementary Data 2.
Figure 4
Figure 4
The reported and model-predicted distributions of dengue and JE at the county level in China. (A) Reported annual incidence rate of human dengue and locations of DENV detected from mosquitoes; (B) spatial distribution of model-predicted incidence rate of dengue; (C) reported annual incidence rate of human JE and locations of JEV detected from mosquitoes and host animals; (D) spatial distribution of model-predicted incidence rate of JE.

References

    1. Franklinos L.H.V., Jones K.E., Redding D.W., Abubakar I. The effect of global change on mosquito-borne disease. Lancet Infect. Dis. 2019;19:e302–e312. doi: 10.1016/S1473-3099(19)30161-6. - DOI - PubMed
    1. Kilpatrick A.M., Randolph S.E. Drivers, dynamics, and control of emerging vector-borne zoonotic diseases. Lancet. 2012;380:1946–1955. doi: 10.1016/S0140-6736(12)61151-9. - DOI - PMC - PubMed
    1. Turtle L., Solomon T. Japanese encephalitis—The prospects for new treatments. Nat. Rev. Neurol. 2018;14:298–313. doi: 10.1038/nrneurol.2018.30. - DOI - PubMed
    1. Reno E., Quan N.G., Franco-Paredes C., Chastain D.B., Chauhan L., Rodriguez-Morales A.J., Henao-Martínez A.F. Prevention of yellow fever in travellers: An update. Lancet Infect. Dis. 2020;20:e129–e137. doi: 10.1016/S1473-3099(20)30170-5. - DOI - PubMed
    1. Kuno G., Chang G.J. Biological transmission of arboviruses: Reexamination of and new insights into components, mechanisms, and unique traits as well as their evolutionary trends. Clin. Microbiol. Rev. 2005;18:608–637. doi: 10.1128/CMR.18.4.608-637.2005. - DOI - PMC - PubMed

Publication types